
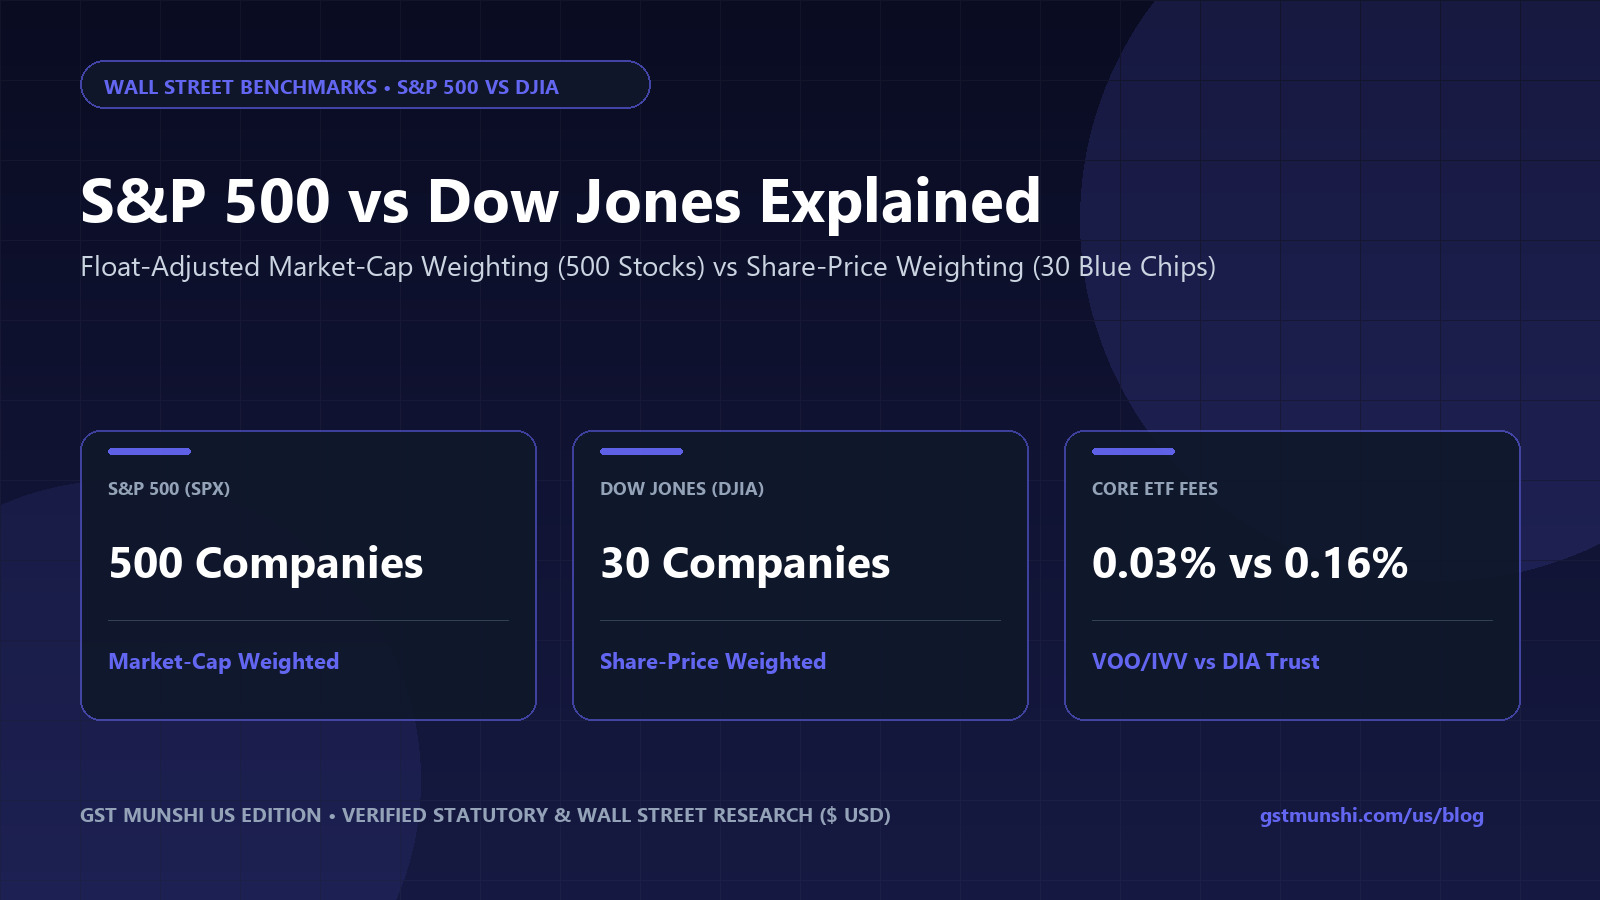
What is the main difference between the S&P 500 and the Dow Jones Industrial Average (DJIA)?
The S&P 500 tracks 500 leading publicly traded US large-cap corporations weighted by their float-adjusted market capitalization (total company value), covering roughly 80% of total US equity market value. In contrast, the Dow Jones Industrial Average (DJIA) tracks only 30 established blue-chip companies weighted solely by their nominal per-share stock price divided by the Dow Divisor—meaning a stock trading at $500/share has ten times more impact on the Dow than a stock trading at $50/share, regardless of company size.
S&P 500 (VOO) vs. Dow Jones Industrial Average (DIA) Weighting & Wealth Calculator
Compare long-term compounding between the market-cap-weighted S&P 500 (500 companies, 0.03% VOO fee) and the share-price-weighted Dow Jones (30 companies, 0.16% DIA fee), and test how the Dow Divisor reacts to share prices.
1Market-Cap Weighting (S&P 500) vs. Share-Price Weighting (Dow Jones) Explained
The most consequential distinction between the S&P 500 and the Dow Jones Industrial Average lies in the mathematical formula used to weight each constituent stock. Introduced in 1957 and maintained by S&P Dow Jones Indices, the S&P 500 weights every company by its float-adjusted market capitalization—calculated by multiplying the company's current share price by the number of publicly tradable shares outstanding (excluding closely held insider or government blocks).
Under market-cap weighting, a $3.4 trillion technology giant naturally carries a much larger weight (~6.5% to 7.0% of the index) than a $25 billion regional manufacturer (~0.05%). This ensures that the S&P 500 accurately mirrors the real macroeconomic footprint and aggregate dollar wealth generated by corporate America.
Created by Charles Dow in May 1896 before electronic computers existed, the Dow Jones Industrial Average still uses an archaic price-weighted formula. Originally, Charles Dow simply added up the share prices of 12 industrial companies and divided by 12. Today, S&P Dow Jones Indices sums the single-share stock prices of the 30 Dow constituents and divides that sum by a proprietary constant called the Dow Divisor (approximately 0.162).
- Float-Adjusted Market Cap Formula: Constituent Weight = (Stock Price × Publicly Floated Shares) ÷ Total S&P 500 Float Market Cap.
- Price-Weighted DJIA Formula: Index Level = Sum of 30 Single Share Prices ÷ Dow Divisor (~0.162).
- Stock Split Distortion in the Dow: When a Dow component executes a 4-for-1 or 10-for-1 stock split, its share price drops proportionally, immediately slashing its influence inside the DJIA even though the company's actual business value has not changed by a single cent.
2How Companies Qualify for the S&P 500 vs. the 30 Stocks of the Dow Jones
Contrary to popular belief, neither the S&P 500 nor the Dow Jones Industrial Average is purely mechanical; both are overseen by the Index Committee at S&P Dow Jones Indices. However, the S&P 500 enforces strict quantitative admission rules. To enter the S&P 500, a company must be a U.S. corporation listed on the NYSE, Nasdaq, or Cboe, maintain an unadjusted market capitalization meeting the current multi-billion-dollar threshold (over $18 billion), maintain at least 50% public float, and report positive cumulative GAAP net income across its most recent four consecutive quarters (including the most recent quarter).
In contrast, selection into the 30-stock Dow Jones Industrial Average is largely qualitative. The Index Committee selects 30 prominent blue-chip industry leaders with sustained earnings histories and broad investor reputation, excluding the Transportation and Utilities sectors (which are tracked separately in the Dow Jones Transportation Average and Dow Jones Utility Average).
Because the Dow is price-weighted, the Committee historically avoided adding ultra-high-priced shares before stock splits (such as Amazon or Alphabet prior to their 20-for-1 splits, or Berkshire Hathaway Class A shares trading above $650,000), because a single high-priced share would overwhelm the entire 30-stock average.
3Sector Breakdown & Historical Return Divergence: Technology Growth vs. Value Tilt
Because the S&P 500 spans 500 companies across all 11 Global Industry Classification Standard (GICS) sectors and lets winning companies grow in weight as their market value compounds, Information Technology and Communication Services represent roughly 38% to 41% of the S&P 500. Secular compounders in artificial intelligence, cloud computing, and digital payments drive its long-term earnings growth.
Meanwhile, the Dow Jones Industrial Average is heavily tilted toward Financials (such as Goldman Sachs, JPMorgan Chase, American Express, and Visa), Healthcare (UnitedHealth Group, Amgen), and Industrials (Caterpillar, Honeywell) strictly because those specific companies happen to have high nominal dollar share prices ($250 to $550+ per share).
Over the past decade, this structural weighting difference caused the S&P 500 to outperform the Dow Jones Industrial Average by roughly 1.1% to 1.6% per year on an annualized total-return basis during technology-led expansions, while the Dow occasionally experiences smaller drawdowns during rising-rate valuation resets.
4How to Invest: Comparing S&P 500 ETFs (VOO, IVV, SPY) vs. the Dow ETF (DIA)
For individual investors building long-term wealth in a Roth IRA, 401(k), or taxable brokerage account, the S&P 500 is both broader and significantly cheaper to own than the Dow Jones Industrial Average. Flagship S&P 500 ETFs—including Vanguard S&P 500 ETF (VOO), iShares Core S&P 500 ETF (IVV), and SPDR Portfolio S&P 500 ETF (SPLG)—charge ultra-low expense ratios of just 0.02% to 0.03% ($2 to $3 per $10,000 invested per year).
By comparison, the primary ETF tracking the Dow Jones Industrial Average—the SPDR Dow Jones Industrial Average ETF Trust (DIA)—is structured as a legacy Unit Investment Trust charging an annual expense ratio of 0.16% ($16 per $10,000 invested), more than five times the fee of VOO or IVV for only 30 underlying stocks.
5When Institutional Traders Use the S&P 500 vs. the Dow Jones in Daily Market Analysis
While financial television anchors often quote 'Dow points' to general audiences out of historical habit, institutional portfolio managers, pension consultants, and quantitative derivatives desks treat the S&P 500 (SPX) as the true benchmark of the U.S. equity market. Watching both indices side-by-side during trading hours provides a rapid sector-rotation signal: when the Dow rises on a day the S&P 500 falls, institutional capital is rotating out of mega-cap technology into defensive industrials, banks, and healthcare.
S&P 500 Index vs. Dow Jones Industrial Average (DJIA) Head-to-Head Comparison
| Comparison Metric | S&P 500 Index (SPX) | Dow Jones Industrial Average (DJIA) |
|---|---|---|
| Number of Constituents | 500 US Large-Cap Companies (~503 tickers) | 30 Established US Blue-Chip Companies |
| Weighting Methodology | Float-Adjusted Market Capitalization | Nominal Single-Share Stock Price (Divisor ~0.162) |
| Total US Market Coverage | ~80% of Total US Equity Market Value | ~25%–28% of Total US Equity Market Value |
| Sector Representation | All 11 GICS Sectors (Strong Tech & Growth Representation) | 9 of 11 Sectors (Excludes Utilities & Real Estate) |
| Impact of a Stock Split | Zero Impact on Company Weight | Directly Reduces the Splitting Stock's Index Weight |
| Primary Benchmark ETFs | VOO (0.03%), IVV (0.03%), SPLG (0.02%), SPY (0.0945%) | DIA — SPDR Dow Jones Trust (0.16% Expense Ratio) |
| Best Suited For | Core Long-Term Wealth & Retirement Compounding | Tracking Traditional Blue-Chip Industrial & Financial Rotation |
4-Step Portfolio Guide to Choosing Between the S&P 500 and the Dow
Anchor Your Core Equity Portfolio in a 0.02%–0.03% S&P 500 Fund
Use VOO, IVV, SPLG, or FXAIX as your primary US large-cap core holding to capture 500 companies weighted by true economic market value at minimal cost.
Ignore Raw 'Dow Point' Headlines in Favor of Percentage Moves
With the Dow trading above 40,000 points, a 400-point drop is merely a routine 1.0% fluctuation; always compare daily percentage changes between SPX and DJIA.
Check Overlapping Holdings Before Combining VOO and DIA
All 30 stocks inside the Dow Jones Industrial Average are already included inside the S&P 500; buying both DIA and VOO simply overweights high-share-price value stocks at a higher fee.
Use Equal-Weight S&P 500 (RSP) or Dividend ETFs (SCHD) Instead of Price-Weighting
If you want to reduce mega-cap tech concentration in the S&P 500, pair VOO with an equal-weight S&P 500 ETF or a fundamental dividend growth ETF rather than relying on the Dow's arbitrary share-price weighting.
Curated Expert Video Walkthroughs & Wall Street Briefings



Frequently Asked Questions (Verified Statutory Answers)
Q1: Why does the S&P 500 have more than 500 stock ticker symbols?
The S&P 500 tracks 500 distinct corporations, but commonly includes 503 ticker symbols because a few constituent companies (such as Alphabet with GOOGL Class A and GOOG Class C shares, Fox Corp, and News Corp) have multiple share classes listed in the index.
Q2: What is the Dow Divisor and why is it less than 1?
When the Dow Jones Industrial Average was created, the sum of the stock prices was simply divided by the number of stocks. Over the past century, stock splits, spin-offs, and constituent replacements required adjusting the divisor downward so the index level wouldn't artificially jump or drop on the day of a split. Today, the Dow Divisor is roughly 0.162, meaning dividing by 0.162 multiplies every $1.00 of share-price change into ~6.17 Dow points.
Q3: Are all 30 Dow Jones stocks also in the S&P 500?
Yes. Every single one of the 30 blue-chip companies in the Dow Jones Industrial Average is also a constituent of the S&P 500 Index. Consequently, anyone who owns an S&P 500 index fund already owns all 30 Dow companies.
Q4: Which has performed better historically: the S&P 500 or the Dow Jones?
Over the past 10-, 20-, and 30-year rolling periods, the S&P 500 has outperformed the Dow Jones Industrial Average on a total-return basis, largely because market-cap weighting captures the full compounding of hyper-growth technology innovators before and after stock splits.
Q5: How often is the S&P 500 rebalanced?
The S&P 500 undergoes quarterly share-float rebalancing on the third Friday of March, June, September, and December, while constituent additions and removals occur on an as-needed basis whenever corporate mergers, acquisitions, or eligibility changes take place.
Q6: Can you buy the S&P 500 or Dow Jones directly without an ETF or mutual fund?
No. Both the S&P 500 and the DJIA are mathematical benchmarks, not tradable corporations. Investors buy exchange-traded funds (like VOO, IVV, SPLG, SPY, or DIA) or index mutual funds (like FXAIX, VFIAX, or SWPPX) that hold the underlying shares in exact index proportions.

Curated Expert Insights & Verified Consumer Disclosures
“Because the Dow Divisor is ~0.162, every $1 change in any of the 30 Dow stocks moves the DJIA by ~6.17 points. That means a 5% move in a $500 stock moves the Dow 10x more than a 5% move in a $50 stock—which is why institutions benchmark exclusively to the S&P 500.”