
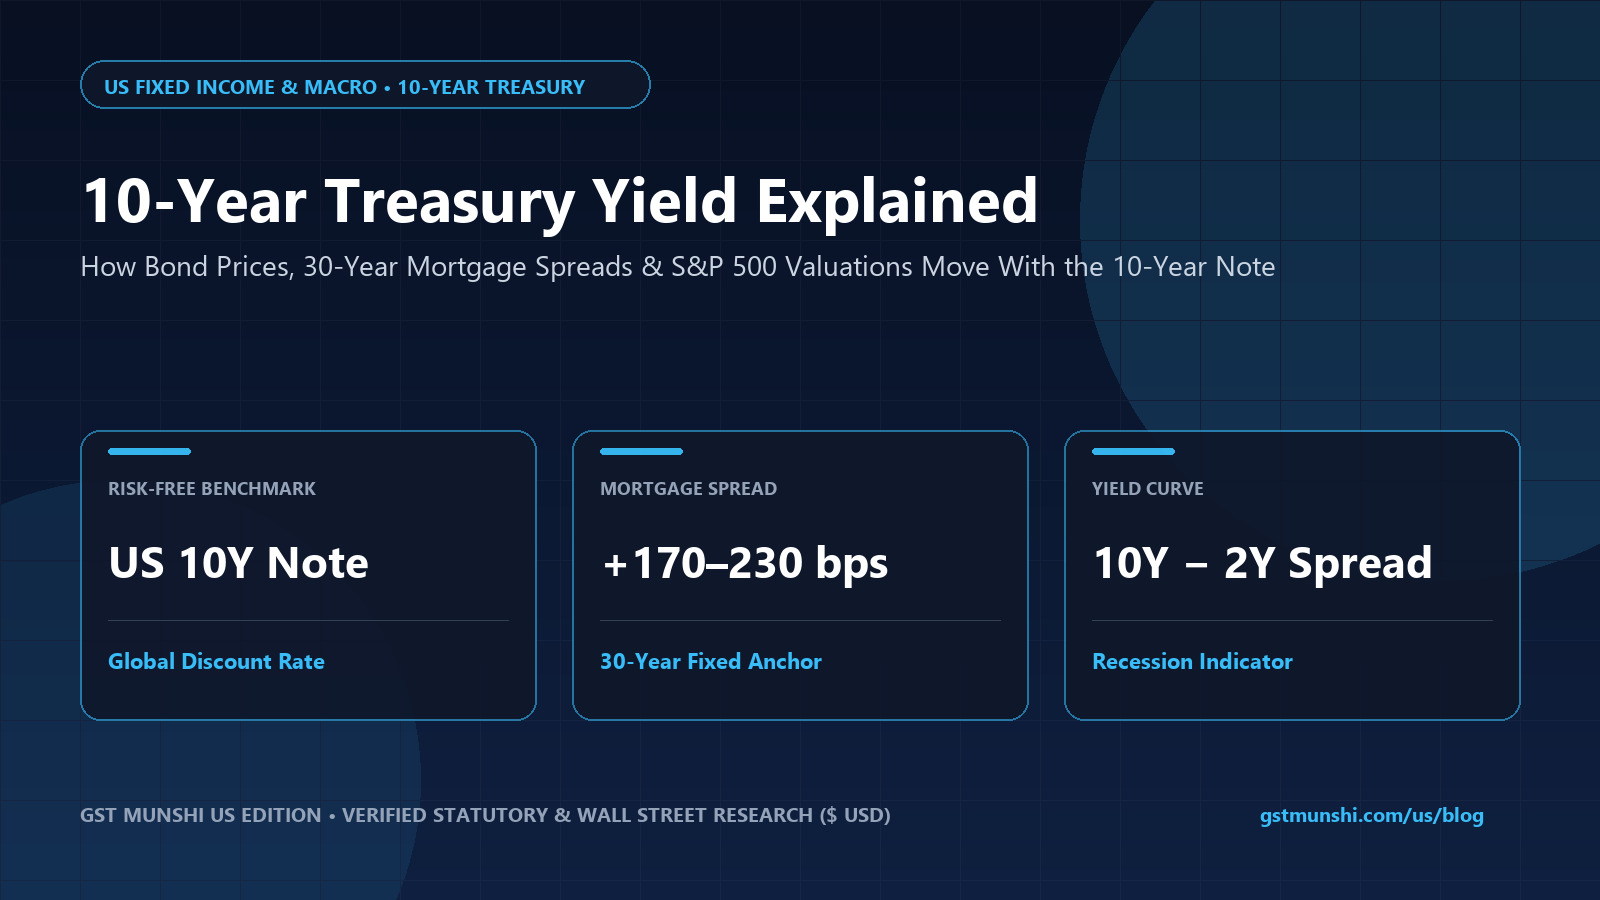
What is the 10-year US Treasury yield and why do Wall Street investors and homebuyers watch it so closely?
The 10-year US Treasury yield is the annualized effective interest rate the United States government pays to borrow money for ten years via Treasury notes issued by the Bureau of the Fiscal Service. Investors watch the 10-year Treasury because it serves as the global 'risk-free' discount rate for valuing S&P 500 equities and directly anchors 30-year fixed residential mortgage rates, corporate borrowing costs, and recession-signaling yield curves.
10-Year US Treasury Yield, 30-Year Mortgage Rate & 10Y–2Y Curve Simulator
Adjust the 10-Year Treasury Note yield, 2-Year Treasury yield, and Secondary Agency MBS spread to see how Treasury yields directly drive 30-year mortgage rates, bond prices, and S&P 500 equity multiples.
1What the 10-Year US Treasury Yield Measures & How Bond Auctions Work
The 10-year US Treasury note (market ticker symbols TNX on Cboe or US10Y on institutional bond desks) is a medium-term sovereign debt obligation backed by the full faith and credit of the United States government under Article I, Section 8 of the U.S. Constitution. When the U.S. Department of the Treasury conducts monthly auctions under 31 C.F.R. Part 356, primary dealers, foreign central banks, pension funds, and retail investors bid on the yield they require to lend capital to the federal government for a full decade.
Once issued, 10-year Treasury notes trade continuously in the secondary fixed-income market with a fixed semi-annual coupon rate set at auction. Because the annual dollar coupon payment remains fixed for ten years, the note's market yield fluctuates inversely with its secondary market trading price. When economic uncertainty or deflationary shocks drive global capital into the safety of U.S. government debt, buying pressure pushes the bond's market price above par ($100), mathematically pushing its effective yield downward.
Conversely, when hotter-than-expected Consumer Price Index (CPI) or Personal Consumption Expenditures (PCE) inflation reports emerge—or when federal fiscal deficits increase total Treasury supply—institutional bondholders demand higher compensation against purchasing-power erosion. That selling pressure drives bond prices lower and forces the 10-year Treasury yield higher across global trading screens.
- Coupon vs. Yield to Maturity (YTM): The coupon rate is fixed at issuance, while the 10-year yield reflects the live annualized total return if purchased today and held to maturity.
- Modified Duration (~8.1 Years): A 1.00% (100 bps) drop in the 10-year yield produces an approximate +8.1% capital price gain on existing 10-year Treasury holdings.
- Federal Tax vs. State Tax: Treasury interest is taxable on federal Form 1040 (reported on Form 1099-INT Box 3) but strictly exempt from state and municipal income taxes under 31 U.S.C. § 3124.
2Why 30-Year Fixed Mortgage Rates Follow the 10-Year Treasury (Not the Fed Funds Rate)
One of the most persistent misconceptions in consumer finance is believing that the Federal Reserve directly sets 30-year fixed mortgage rates. In reality, the Federal Open Market Committee (FOMC) only controls the overnight Federal Funds Rate—the interest rate banks charge each other for overnight reserve loans—which directly governs credit card APRs, Home Equity Lines of Credit (HELOCs), and auto loans.
Although a residential mortgage contract spans 30 years, the average American homeowner sells their property, relocates, or refinances every 7 to 10 years. Because mortgage cash flows have an effective empirical duration of roughly 8 to 10 years, Wall Street investors who purchase Fannie Mae and Freddie Mac Agency Mortgage-Backed Securities (MBS) benchmark those mortgage bonds directly against the 10-year US Treasury yield.
To compensate MBS investors for prepayment risk—the risk that homeowners will refinance and return principal early whenever interest rates fall—mortgage lenders add a secondary market spread of 170 to 230 basis points (1.70% to 2.30%) on top of the 10-year Treasury yield. If the 10-year Treasury trades at 4.15% and the prevailing MBS spread is 195 basis points, the national average 30-year conforming mortgage rate settles near 6.10%.
3How the 10-Year Treasury Yield Drives S&P 500 & NASDAQ-100 Stock Valuations
On Wall Street, institutional equity analysts value publicly traded corporations using Discounted Cash Flow (DCF) models that discount projected future free cash flows back to present-day dollars. The foundational baseline inside the Weighted Average Cost of Capital (WACC) formula is the 10-year US Treasury yield, known universally as the risk-free rate ($R_f$).
When the 10-year Treasury yield sits at 2.50%, investors are willing to pay 24x to 28x forward earnings for S&P 500 and NASDAQ-100 growth companies because safe government bonds offer modest competition. However, if the 10-year Treasury yield surges above 4.50% or 5.00%, the mathematical denominator in every DCF valuation expands, reducing the present value of corporate profits expected five or ten years in the future.
This discount-rate sensitivity explains why long-duration assets—such as high-growth technology stocks, semiconductor designers, and pre-profitability biotech firms—experience sharp valuation multiple compression whenever the 10-year Treasury yield spikes rapidly, whereas cash-rich value sectors like commercial banks, insurance carriers, and energy producers often outperform.
4Decoding the 10-Year Minus 2-Year Treasury Yield Curve & Term Premium
Fixed-income strategists and Federal Reserve economists monitor the spread between the 10-year Treasury yield and the 2-year Treasury yield (recorded on the St. Louis Fed FRED database as T10Y2Y) as the bond market's premier macroeconomic barometer. Under normal economic expansions, the yield curve slopes upward: the 10-year note yields 50 to 150 basis points more than the 2-year note because investors demand extra 'term premium' for locking up capital over a decade.
When the Federal Reserve hikes short-term interest rates aggressively to combat inflation, the 2-year Treasury yield rises alongside the Fed Funds expectation while long-term 10-year buyers anticipate an eventual economic slowdown. This causes the 10-year yield to fall below the 2-year yield—a phenomenon called a Yield Curve Inversion.
Crucially, economic recessions historically begin not at the moment the yield curve first inverts, but during the 'un-inversion' (bull steepening) phase, when rising unemployment forces the Federal Reserve to cut short-term 2-year rates faster than long-term 10-year yields decline.
- Normal Upward Curve (+50 to +150 bps): Signals sustainable GDP expansion, healthy bank net interest margins, and positive term premium.
- Flat Curve (-15 to +25 bps): Indicates monetary policy transition as the Federal Reserve approaches its terminal or neutral interest rate.
- Inverted Curve (< -25 bps): Historically preceded every major US post-war recession within 12 to 24 months by tightening bank credit creation.
5Nominal 10-Year Yield vs. Real Yield (TIPS) & Breakeven Inflation Expectations
To understand what the 10-year Treasury is truly signaling, institutional macro desks decompose the headline nominal 10-year yield into two distinct components using the Fisher Equation: the 10-Year Real Yield (measured by 10-Year Treasury Inflation-Protected Securities, or TIPS) plus the 10-Year Breakeven Inflation Rate.
For example, if the standard nominal 10-year Treasury note yields 4.15% and the 10-year TIPS real yield is 1.90%, the bond market's implied 10-year breakeven inflation expectation is exactly 2.25% per year. When nominal yields rise primarily because real TIPS yields are climbing, it reflects strong real economic growth or heavy Treasury bond issuance; when nominal yields rise because breakeven inflation is widening, it warns that bond vigilantes fear resurgent inflation.
US Treasury Maturity Spectrum & Financial Impact Comparison (2026–2027)
| Treasury Security | Maturity Term | Primary Macro Driver | Consumer & Portfolio Impact |
|---|---|---|---|
| 4-Week to 52-Week T-Bills | 1 to 12 Months | Overnight FOMC Fed Funds Rate | Sets High-Yield Savings (HYSA), Money Market Funds & CD APYs |
| 2-Year Treasury Note | 2 Years | Expected Fed Policy Over Next 8 FOMC Meetings | Drives Auto Loan Rates, Short-Term Corporate Debt & 10Y–2Y Spread |
| 10-Year Treasury Note | 10 Years | Long-Run GDP Growth + Inflation + Term Premium | Benchmarks 30-Year Fixed Mortgages, Corporate Bonds & S&P 500 P/E |
| 10-Year TIPS (Inflation-Protected) | 10 Years | Real Risk-Free Return Above CPI-U Inflation | Governs Gold Prices, Real Estate Cap Rates & Tech Multiples |
| 30-Year Treasury Bond | 30 Years | Multi-Decade Fiscal Deficit & Pension Liability Demand | Maximum Duration Sensitivity (~16.5 yrs) for Institutional Hedging |
4-Step Investor Playbook for Using the 10-Year Treasury Yield
Check the 10-Year Yield + MBS Spread Before Locking a Mortgage Rate
Monitor live 10-year Treasury movements on morning bond markets before signing a 30-to-60-day mortgage rate lock; intraday drops of 10–15 bps in the 10-year note often translate into lower lender rate sheets by afternoon.
Compare S&P 500 Earnings Yield Against the 10-Year Treasury Yield
Invert the S&P 500 forward P/E ratio (e.g., 1 ÷ 21 = 4.76% earnings yield) and subtract the 10-year Treasury yield to measure the Equity Risk Premium before overweighting expensive growth stocks.
Use Treasury Notes or ETFs in High-Tax States to Save 5%–13% State Tax
Residents of California, New York, New Jersey, and Massachusetts can purchase individual 10-year Treasury notes on TreasuryDirect/brokerages or hold US Treasury ETFs to capture 100% state-tax-exempt interest under 31 U.S.C. § 3124.
Match Bond Duration to Your Exact Cash-Flow Horizon
Never park short-term emergency savings in 10-year Treasury funds due to ~8.1-year duration price volatility; keep 1–2 year cash in T-Bills and use 7–10 year Treasuries strictly as a multi-year portfolio ballast.
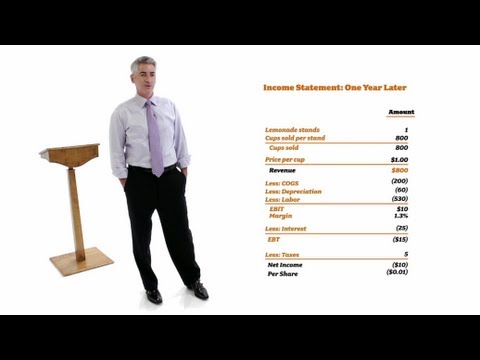
Curated Expert Video Walkthroughs & Wall Street Briefings


Frequently Asked Questions (Verified Statutory Answers)
Q1: Why do 10-year Treasury bond prices go down when the 10-year yield goes up?
Existing 10-year Treasury notes pay a fixed dollar coupon determined at auction. If new 10-year notes are being issued at higher market interest rates (for example, 4.50% instead of 3.50%), no buyer will pay full face value ($100) for an older 3.50% bond unless its market price is discounted low enough that its total yield matches the new 4.50% prevailing rate.
Q2: Does the Federal Reserve directly set the 10-year Treasury yield?
No. The Federal Reserve sets the overnight Federal Funds Rate target range. While FOMC rate projections and Quantitative Tightening (QT) balance-sheet policies influence bond traders, the 10-year Treasury yield is set every second by open-market supply and demand among global institutional investors.
Q3: How can retail investors buy 10-year US Treasury notes or track the yield?
Investors can purchase new-issue 10-year Treasury notes at auction or in the secondary market with $0 commission through major US brokerages (Fidelity, Vanguard, Charles Schwab) in $1,000 par increments, via TreasuryDirect.gov ($100 minimum), or through low-cost intermediate Treasury ETFs such as iShares 7-10 Year Treasury Bond ETF (IEF) or US Benchmark Series 10-Year Note ETF (UTEN).
Q4: Are 10-year US Treasury interest payments exempt from state income taxes?
Yes. Under federal statute 31 U.S.C. § 3124(a), interest income from US Treasury bills, notes, and bonds is subject to federal income tax on IRS Form 1040, but is 100% exempt from all state, county, and municipal income taxes.
Q5: What is a normal spread between the 10-year Treasury yield and 30-year mortgage rates?
Over the past three decades, the historical average spread between the 10-year US Treasury yield and the Freddie Mac 30-year fixed conforming mortgage rate has ranged between 170 and 200 basis points (1.70% to 2.00%). During periods of high interest-rate volatility or Federal Reserve MBS runoff, that spread can widen to 230–270 basis points before normalizing.
Q6: What ticker symbol tracks the 10-year Treasury yield on stock charting platforms?
On most US brokerage platforms and financial terminals, the Cboe 10-Year Treasury Note Yield Index is tracked under the ticker symbol ^TNX (or TNX), which quotes the yield multiplied by 10 (for example, a TNX reading of 41.50 represents a 4.15% yield). Financial portals also display it directly as US10Y.


Curated Expert Insights & Verified Consumer Disclosures
“Homebuyers waiting on FOMC rate cuts often look at the wrong rate. Watch the 10-Year Treasury Note and the primary-secondary mortgage spread. When the 10Y holds near 4.00% and MBS volatility calms, 30-year conforming rates compress below 6% regardless of overnight noise.”