
What is a stock ticker symbol and how do you read all the numbers on a standard US stock quote?
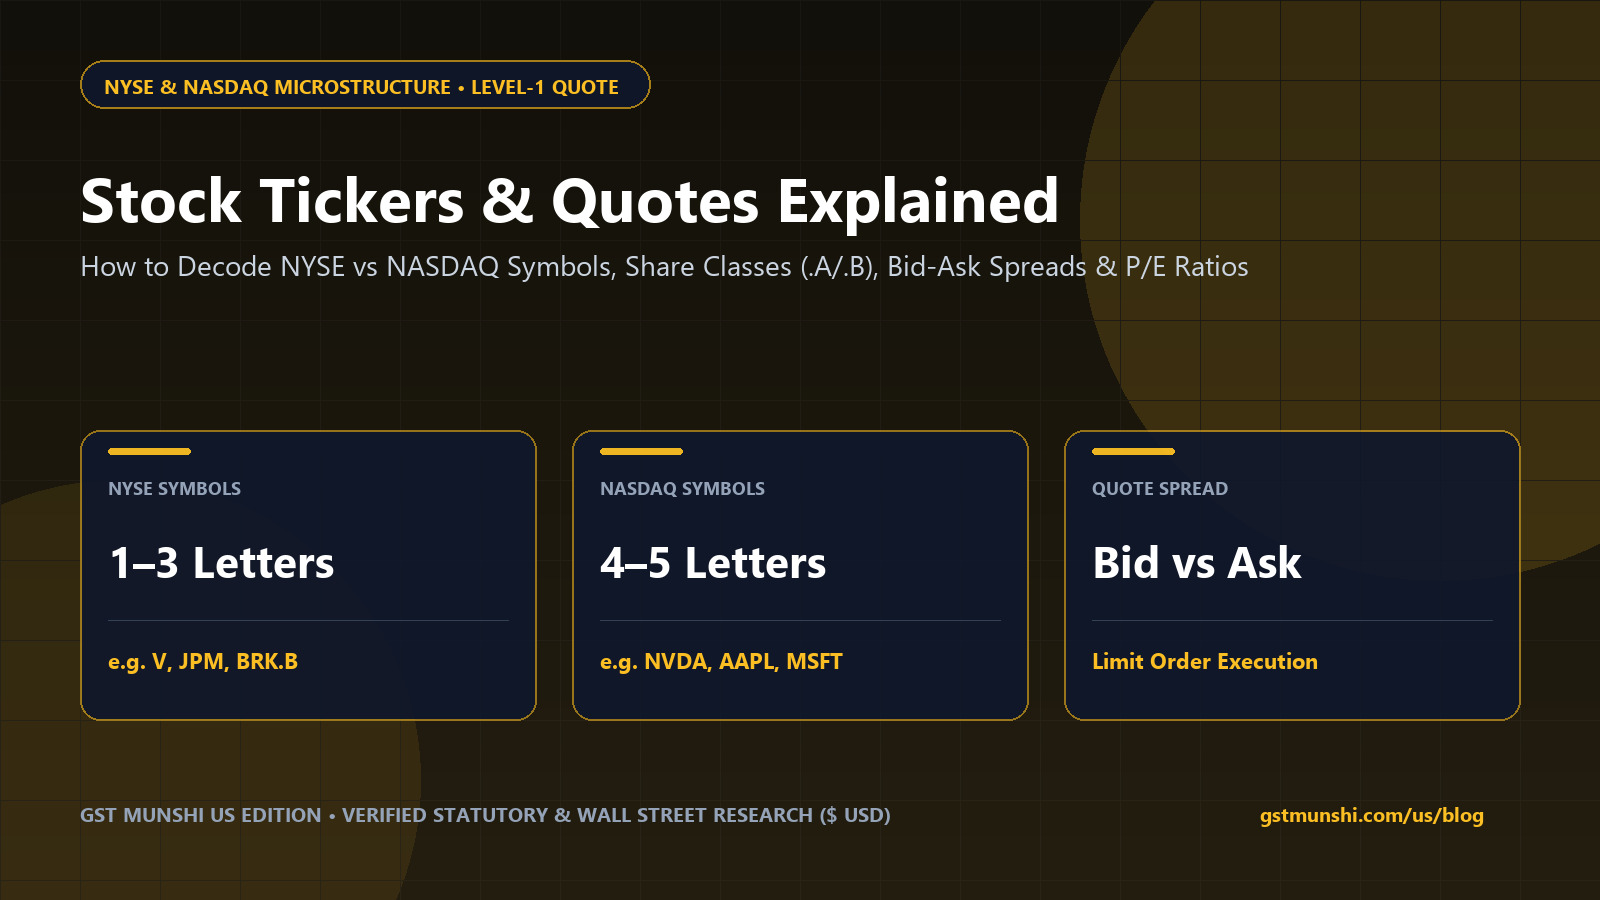
A stock ticker symbol is a unique 1-to-5 letter code assigned to a publicly traded company or ETF on stock exchanges like the NYSE (traditionally 1 to 3 letters, e.g., V, JPM, KO) and NASDAQ (typically 4 letters, e.g., NVDA, AAPL, MSFT). A standard Level-1 stock quote displays the Last Trade Price, Bid Price (highest buyer offer), Ask Price (lowest seller price), Trading Volume, 52-Week High/Low range, Market Capitalization, Price-to-Earnings (P/E) Ratio, and Dividend Yield.
US Stock Ticker Symbol & Live Quote Microstructure Analyzer
Select a live NYSE or NASDAQ ticker structure below to decode its exchange convention, bid-ask spread, market capitalization, P/E valuation multiple, and dividend yield.
Standard 4-character NASDAQ Global Select Market common stock ticker.
1NYSE vs. NASDAQ Ticker Symbol Rules: 1–3 Letters vs. 4–5 Character Codes
Every equity security traded on U.S. national securities exchanges is identified by an alphanumeric root symbol governed by the National Market System (NMS) Plan for the Selection and Reservation of Securities Symbols, overseen by the Securities and Exchange Commission (SEC). Historically, the length of a ticker symbol immediately revealed which exchange listed the stock.
Companies listed on the New York Stock Exchange (NYSE) traditionally use 1, 2, or 3 letters—including prestigious single-letter tickers such as Visa (V), Ford Motor Company (F), Citigroup (C), and AT&T (T), alongside classic two- and three-letter symbols like JPMorgan Chase (JPM), Coca-Cola (KO), and IBM. Conversely, companies listed on the NASDAQ stock market traditionally use 4-letter ticker symbols, such as NVIDIA (NVDA), Apple (AAPL), Microsoft (MSFT), Amazon (AMZN), and Tesla (TSLA).
In 2007, the SEC ruled that corporations transferring their listing from the NYSE to NASDAQ (or vice versa) may keep their existing 1-to-3 or 4-letter ticker symbol to prevent investor confusion—which is why Walmart (WMT) retained its 3-letter ticker when moving its primary listing to Nasdaq, and Oracle (ORCL) retained its 4-letter symbol when moving to the NYSE.
- 1 to 3 Characters: Traditional NYSE & NYSE Arca (ETFs like VOO, SPY, QQQ, DIA) convention.
- 4 Characters: Standard NASDAQ Global Select & Capital Market corporate equity convention.
- 5 Characters Ending in 'X': Denotes an open-end Mutual Fund priced once daily at 4:00 PM ET (e.g., VFIAX, FXAIX, SWPPX).
3Inside a Level-1 Stock Quote: Last Price, Bid-Ask Spread, Volume & 52-Week Range
When you pull up a stock ticker on a brokerage screen, the headline bold dollar figure is the 'Last Price'—the price at which the most recent transaction occurred, NOT necessarily the price you will get on your next order. Beneath the Last Price sit the two prices that actually govern live trade execution under SEC Regulation NMS (National Best Bid and Offer, or NBBO): the Bid and the Ask.
The 'Bid' ($138.48 x 500) is the highest price a market buyer is currently willing to pay and the number of round-lot shares demanded at that price. The 'Ask' or 'Offer' ($138.52 x 800) is the lowest price a seller is currently willing to accept. The difference between them ($0.04) is the Bid-Ask Spread.
On ultra-liquid S&P 500 stocks and ETFs like NVDA, AAPL, VOO, and SPY during regular trading hours (9:30 AM – 4:00 PM ET), the bid-ask spread is often just $0.01 to $0.02 (less than 1 basis point). On thinly traded small-cap stocks or during pre-market/after-hours sessions, spreads can widen to $0.50 or more—making Limit Orders mandatory to avoid slippage.
4Market Cap, P/E Ratio, EPS, Beta & Dividend Yield: What the Fundamental Numbers Mean
The second half of every stock quote table summarizes the company's fundamental size, profitability, volatility, and shareholder payouts. New investors frequently mistake a low share price ($12/share) for a 'cheap' company and a high share price ($500/share) for an 'expensive' one. Share price alone is meaningless without knowing how many slices the corporate pie is divided into.
Market Capitalization (Share Price × Total Shares Outstanding) measures the true equity size of the company, categorizing stocks into Mega-Cap ($200B+), Large-Cap ($10B–$200B), Mid-Cap ($2B–$10B), and Small-Cap ($300M–$2B). To evaluate whether a stock is expensive relative to its profits, investors examine Earnings Per Share (EPS = Net Income ÷ Shares) and the Price-to-Earnings (P/E) Ratio (Share Price ÷ EPS), which shows how many dollars investors are paying for each $1.00 of annual corporate profit.
- Trailing P/E vs. Forward P/E: Trailing P/E uses the last 4 quarters of audited GAAP earnings; Forward P/E uses Wall Street consensus estimates for the next 12 months.
- Beta (5-Year Monthly): Measures stock volatility relative to the S&P 500 (Beta = 1.0). A Beta of 1.65 means the stock historically swings 65% wider than the market; a Beta of 0.55 indicates a defensive, low-volatility stock.
- Dividend Yield & Ex-Dividend Date: Annual cash dividend divided by share price; you must own the stock BEFORE the Ex-Dividend Date to receive the next quarterly payout.
Complete US Stock Quote Field-by-Field Reference Dictionary
| Stock Quote Term | Example Reading | Formula / Definition | Why It Matters Before You Click Buy |
|---|---|---|---|
| Bid / Ask & Size | $138.48 (x4) / $138.52 (x6) | Highest Buyer Bid vs. Lowest Seller Ask (x100 share lots) | Determines immediate execution cost; use Limit Orders if spread > 0.10% |
| Day's Range & 52-Wk Range | $136.20–$139.10 / $92.00–$149.70 | Lowest and highest traded prices today and over the past 252 trading days | Shows where current price sits relative to annual support and resistance |
| Volume vs. Avg. Volume | 48.2M / 41.5M (90-Day Avg) | Total shares traded today vs. rolling 3-month daily average | Above-average volume confirms institutional conviction on breakouts or earnings |
| Market Capitalization | $3.39 Trillion | Current Share Price × Total Common Shares Outstanding | True measure of company size (Mega, Large, Mid, or Small Cap) |
| P/E Ratio (TTM) & EPS | 46.9x (EPS: $2.95) | Share Price ÷ Trailing 12-Month Diluted Earnings Per Share | Measures valuation multiple relative to historical norms and industry peers |
| Dividend & Yield (Ex-Date) | $2.36 (0.81%) • Ex: Nov 15 | Annualized Cash Dividend ÷ Current Share Price | Shows cash income yield; buy before Ex-Dividend date to qualify for payout |
4-Step Checklist Before Placing Any US Stock Ticker Order
Verify the Exact Ticker Symbol & Exchange to Avoid Ticker Confusion
Double-check the company's legal name and exchange before submitting an order so you never confuse look-alike symbols (such as Zoom Video 'ZM' vs. 'ZOOM', or Ford 'F' vs. Forward Air 'FWRD').
Check the Bid-Ask Spread and Select a Limit Order
Instead of placing a blind Market Order, enter a Limit Order at or between the current Bid and Ask price to guarantee your maximum purchase price.
Compare Market Cap and Forward P/E Against Sector Peers
Never judge a stock by its dollar share price alone; compare its P/E ratio, revenue growth rate, and free cash flow yield against its top three industry competitors.
Inspect Upcoming Earnings Date & Ex-Dividend Date on the Quote Card
Check if the company reports quarterly SEC 10-Q earnings within the next 7 days, as post-earnings implied volatility can cause 5%–15% overnight price gaps.
Curated Expert Video Walkthroughs & Wall Street Briefings


Frequently Asked Questions (Verified Statutory Answers)
Q1: What is the difference between GOOGL and GOOG stock tickers?
Both GOOGL and GOOG represent shares in Alphabet Inc. (Google's parent company) with identical economic ownership. GOOGL is Class A common stock, which grants shareholders 1 vote per share at annual corporate meetings. GOOG is Class C capital stock, which carries zero voting rights.
Q2: Why do mutual fund tickers always have 5 letters ending in 'X'?
Under FINRA and NASD symbol conventions, open-end mutual funds are assigned 5-letter ticker symbols ending in the letter 'X' (such as VFIAX, FXAIX, VTSAX, or SWPPX) to distinguish them from exchange-traded funds (ETFs) and individual stocks that trade intraday.
Q3: Does a $10 stock have more room to grow than a $500 stock?
No. Share price is purely arbitrary and depends on how many total shares the company has issued. A $500/share company with 10 million shares has a Market Cap of $5 billion, whereas a $10/share company with 10 billion shares has a Market Cap of $100 billion (20 times larger). Always evaluate Market Capitalization and P/E ratio, not nominal share price.
Q4: What does 'N/A' or a dash next to P/E Ratio mean on a stock quote?
If a stock quote displays 'N/A' or '—' for its P/E ratio, it means the company reported negative net income (a net loss) over the trailing 12 months, or it is an exchange-traded product (such as a gold or Treasury bond ETF) that does not generate corporate earnings.
Q5: What does a 5-letter ticker ending in 'Y' or 'F' mean?
On US Over-the-Counter (OTC) markets, a 5-letter ticker ending in 'Y' indicates an American Depositary Receipt (ADR) issued by a U.S. bank representing shares of a foreign company in USD, while a ticker ending in 'F' represents direct foreign ordinary shares (which may carry foreign custody fees at some brokerages).
Q6: When does a buyer qualify to receive a stock's dividend shown on the quote?
Under SEC T+1 (next business day) trade settlement rules, you must buy the stock at least one trading day BEFORE the Ex-Dividend Date listed on the stock quote. If you buy the stock on or after the Ex-Dividend Date, the seller receives that upcoming dividend payment.
Curated Expert Insights & Verified Consumer Disclosures
“Retail investors often look only at the Last Trade price. In pre-market (4:00–9:30 AM ET) or on small-cap tickers, the Last Trade might be $45.00 while the live Bid/Ask is $43.50 / $46.80. Always read the NBBO Bid/Ask and use a Limit Order.”