
Quick Summary & Key Takeaways (Featured Snippet)
Interactive MCX & Domestic 1 Kg Silver Valuation Calculator
Simulate 2027 Indian silver retail rates based on COMEX spot, USDINR parity, import customs tariffs, and GST.
CIF Import Landed Cost
₹1,13,963
Ex-GST Vault Point
Duty & GST Component
₹9,870
Total Tax Burden
Projected 1 Kg Silver Rate
₹1,19,091
Inclusive of 3% GST
Projected 10 Gram Rate
₹1,191
(₹119/gram)
The Multi-Year Structural Supply Deficit: Why Silver Cannot Be Printed
Unlike paper currencies, sovereign debt bonds, or digital tokens, physical silver cannot be created through legislative fiat or central bank balance sheet expansion. The global silver market has entered its most severe multi-year structural deficit in recorded modern history. Data compiled by the Silver Institute and Metals Focus confirms that total global demand has outpaced total mine supply plus secondary scrap recycling for four consecutive years, creating a cumulative deficit exceeding 800 million troy ounces.
The root of this shortage lies in geology. More than 72% of all mined silver is produced not from primary silver mines, but as an incidental byproduct of lead, zinc, copper, and gold extraction. Primary silver mining operations account for less than 28% of total global output. As a consequence, even if spot silver prices double or triple, diversified mining conglomerates in Mexico, Peru, and Chile cannot open new mines or flood the market with silver without drastically depressing global base metal prices.
Furthermore, above-ground stockpiles held in London Bullion Market Association (LBMA) vaults and COMEX-approved depositories have depleted by over 38% since 2021. In Asia, the Shanghai Gold Exchange (SGE) has witnessed sustained physical delivery outflows, pushing Chinese spot silver to persistent premiums of $2.50 to $4.50 per ounce above Western spot quotations. When physical inventory vanishes from institutional vaults, market dynamics transition from paper contract speculation to acute physical scarcity.
The Clean-Tech Revolution: TOPCon Solar Cells and EV Electronics
Silver is the most electrically and thermally conductive metal on Earth. While gold is hoarded predominantly as a central bank reserve asset and jewelry store of value, over 55% of all silver mined annually is consumed in industrial fabrication, never to return to the market.
The solar photovoltaic (PV) sector represents the single largest structural growth engine. The solar manufacturing industry has rapidly decommissioned legacy P-type PERC cells in favor of high-efficiency N-type TOPCon (Tunnel Oxide Passivated Contact) and heterojunction (HJT) architectures. While a standard PERC panel required approximately 10 to 12 milligrams of silver per watt, TOPCon cells demand 16 to 22 milligrams per watt—representing an immediate 40% to 80% surge in silver intensity per gigawatt installed.
With global renewable energy mandates expanding worldwide solar installations beyond 600 gigawatts annually toward 2027, the solar industry alone is projected to consume more than 230 to 260 million ounces of silver per year—representing nearly 30% of total worldwide mine supply. Industrial thrifting (reducing silver content through screen-printing refinements) has reached its physical limits; further silver reduction causes unacceptable cell resistance and compromises 25-year solar warranty obligations.
| Industrial Sector | Annual Demand (Moz) | Silver Intensity Factor | 2027 Growth Vector |
|---|---|---|---|
| Solar Photovoltaics (TOPCon/HJT) | 235 – 260 Moz | 16–22 mg/watt (+60% vs PERC) | Global grid solar mandate & rooftops |
| Electric Vehicles & Charging Infra | 90 – 115 Moz | 25–50g per EV (vs 15g ICE car) | High-voltage battery contactors & inverters |
| AI Data Centers & 5G Base Stations | 45 – 60 Moz | Thermal interface pads & switches | Megawatt power distribution busbars |
| Medical & Water Purification Tech | 30 – 35 Moz | Antimicrobial silver ion coatings | Nanotechnology and surgical equipment |
Expert Video Analysis: Silver Supply Deficit & Solar Boom
The Gold-to-Silver Ratio: Mean Reversion to 65:1 and 50:1
The Gold-to-Silver Ratio (GSR) is one of the oldest macroeconomic metrics in financial history, calculated by dividing the spot price of one ounce of gold by the spot price of one ounce of silver. During the Earth's geological formation, silver was deposited in the crust at a ratio of approximately 16 to 1 relative to gold. Throughout ancient and modern monetary history, legal monetary ratios ranged between 12:1 and 16:1.
Over the past two decades, paper derivatives and algorithmic trading distorted the GSR, pushing it to historic extremes between 85:1 and 95:1. However, during secular commodity bull markets—such as 1979–1980 and 2010–2011—the ratio aggressively contracted down to 32:1 and 30:1 respectively.
With international gold prices establishing firm support above $2,600 to $2,800 per ounce, a conservative mean reversion of the GSR toward its 50-year median of 65:1 indicates an international silver target of $40.00 to $43.00 per ounce. If the ratio tightens further toward 55:1—as observed during intense physical shortages—silver would trade at $47.00 to $51.00 per ounce, propelling Indian MCX prices comfortably past ₹1,40,000 to ₹1,55,000 per kilogram.
How Domestic Silver Prices Are Calculated in India (Import Parity Formula)
India imports over 90% of its total physical silver consumption. Consequently, the price of silver at Zaveri Bazaar in Mumbai or on the Multi Commodity Exchange (MCX) is derived through a transparent international import parity mathematical formula:
# Official Indian MCX 1 Kg Silver Parity Formula:
1 Troy Ounce = 31.1035 Grams
1 Kilogram = 32.1507 Troy Ounces
Base Price (USD/kg) = COMEX Spot (USD/oz) × 32.1507
CIF Landed Cost (INR/kg) = Base Price (USD) × USDINR Rate × (1 + 0.06 Basic Customs Duty)
Domestic Retail Price (INR/kg) = CIF Landed Cost × (1 + 0.03 GST) + Local Handling / Premium
Prior to July 2024, the Indian government levied a crippling 15% customs duty on silver. This high tariff created grey-market cash distortions and depressed official exchange volumes. The Union Budget rationalization to 6% Basic Customs Duty (BCD) leveled the playing field, channeled institutional trades through GIFT City International Bullion Exchange (IIBX), and ensured that domestic investors pay true fair-value international spot prices.
Silver Price Projections for 2027: Bull, Base, and Bear Case Matrix
| Economic Scenario | COMEX Spot (USD/oz) | Assumed USDINR | MCX 1 Kg Target | Primary Macro Catalysts |
|---|---|---|---|---|
| Hyper-Bull Case (Top 20%) | $48.00 – $54.00 | ₹89.50 – ₹91.00 | ₹1,55,000 – ₹1,75,000 | Acute physical squeeze, SGE vault depletion, GSR reaches 50:1, aggressive Fed rate cuts |
| Baseline Consensus (60%) | $38.00 – $44.00 | ₹87.50 – ₹89.00 | ₹1,25,000 – ₹1,45,000 | Sustained 200+ Moz deficit, solar cell boom, steady USDINR depreciation, GSR at 65:1 |
| Bear / Stagnation Case (20%) | $29.00 – $32.00 | ₹85.00 – ₹86.50 | ₹95,000 – ₹1,08,000 | Global industrial recession, copper substitution breakthroughs, strong USD surge |
Expert Video Analysis: Silver Investment Strategy & ETFs
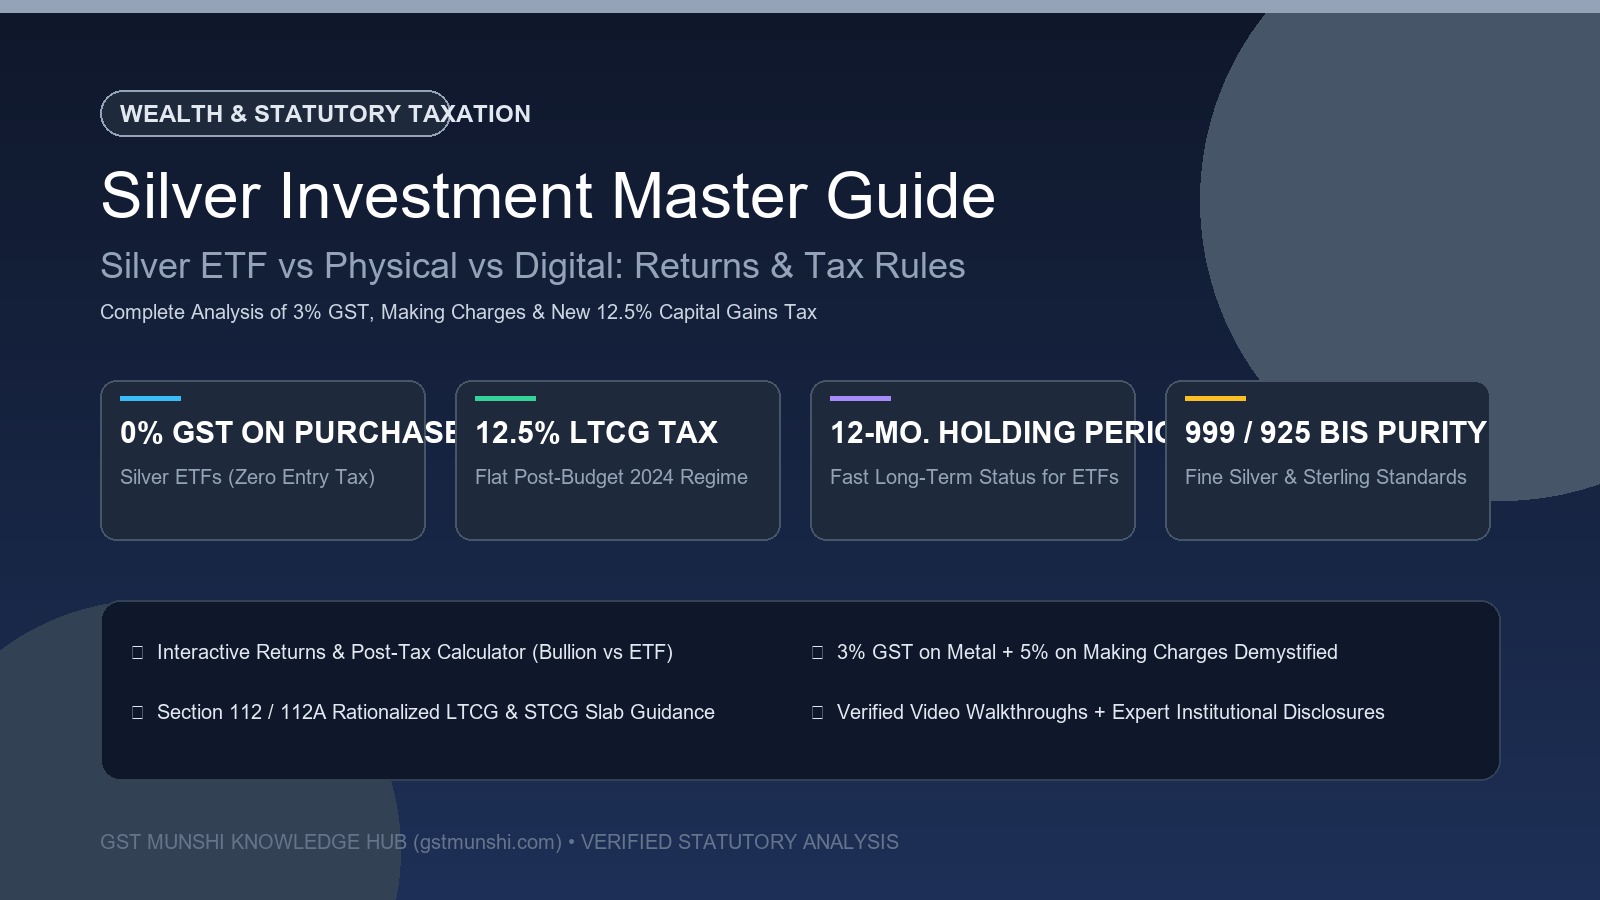
Physical Silver Bars vs Silver ETFs vs Digital Silver: Which is Superior?
| Evaluation Metric | Physical Bars / Coins (999) | Silver ETFs (NSE/BSE) | Silver Mutual Fund FoF |
|---|---|---|---|
| Purity Guarantee | BIS Hallmarking required (99.9%) | 100% Vault Audited 999 Purity | 100% Vault Audited 999 Purity |
| Making / Premium Costs | 3% to 8% lost on purchase | 0% (Traded at NAV parity) | 0% (Purchased at NAV) |
| Storage & Theft Risk | Bank locker fees or home risk | Zero (SEBI-regulated custodian) | Zero (SEBI-regulated custodian) |
| Liquidity & Exit | Jeweler appraisal & melt deductions | Instant intraday execution | T+1 redemption through AMC |
| LTCG Tax (>12 Mos) | 12.5% without indexation | 12.5% without indexation | 12.5% without indexation |
| SIP Capability | Manual purchases only | Stock SIP via Demat broker | Automated bank mandate SIP (₹500/mo) |
Institutional 4-Step Accumulation Roadmap for 2026–2027
Fix Allocation at 3% to 7%
Silver is a high-beta hybrid commodity with annualized volatility roughly double that of gold. Cap total portfolio allocation at 3% to 7% to capture explosive industrial upside without introducing unmanageable portfolio drawdown risk.
Deploy Systematic Monthly SIPs
Never deploy lump sums at 52-week highs. Utilize Silver ETF or Silver Fund of Funds (FoF) monthly SIPs to dollar-cost average across interim pullbacks and consolidate positions ahead of the 2027 solar acceleration wave.
Monitor the Gold-to-Silver Ratio
When the GSR hovers between 85:1 and 90:1, aggressively tilt fresh precious metals allocations into silver. When the ratio compresses below 60:1 toward 50:1, systematically book silver profits and rotate capital back into sovereign gold or debt funds.
Demand BIS Hallmarking for Physical
If purchasing physical bullion ingots or coins, demand 999 fine hallmarked bullion certified by a BIS-recognized refinery with serialized assay cards to eliminate melting deductions upon resale.