
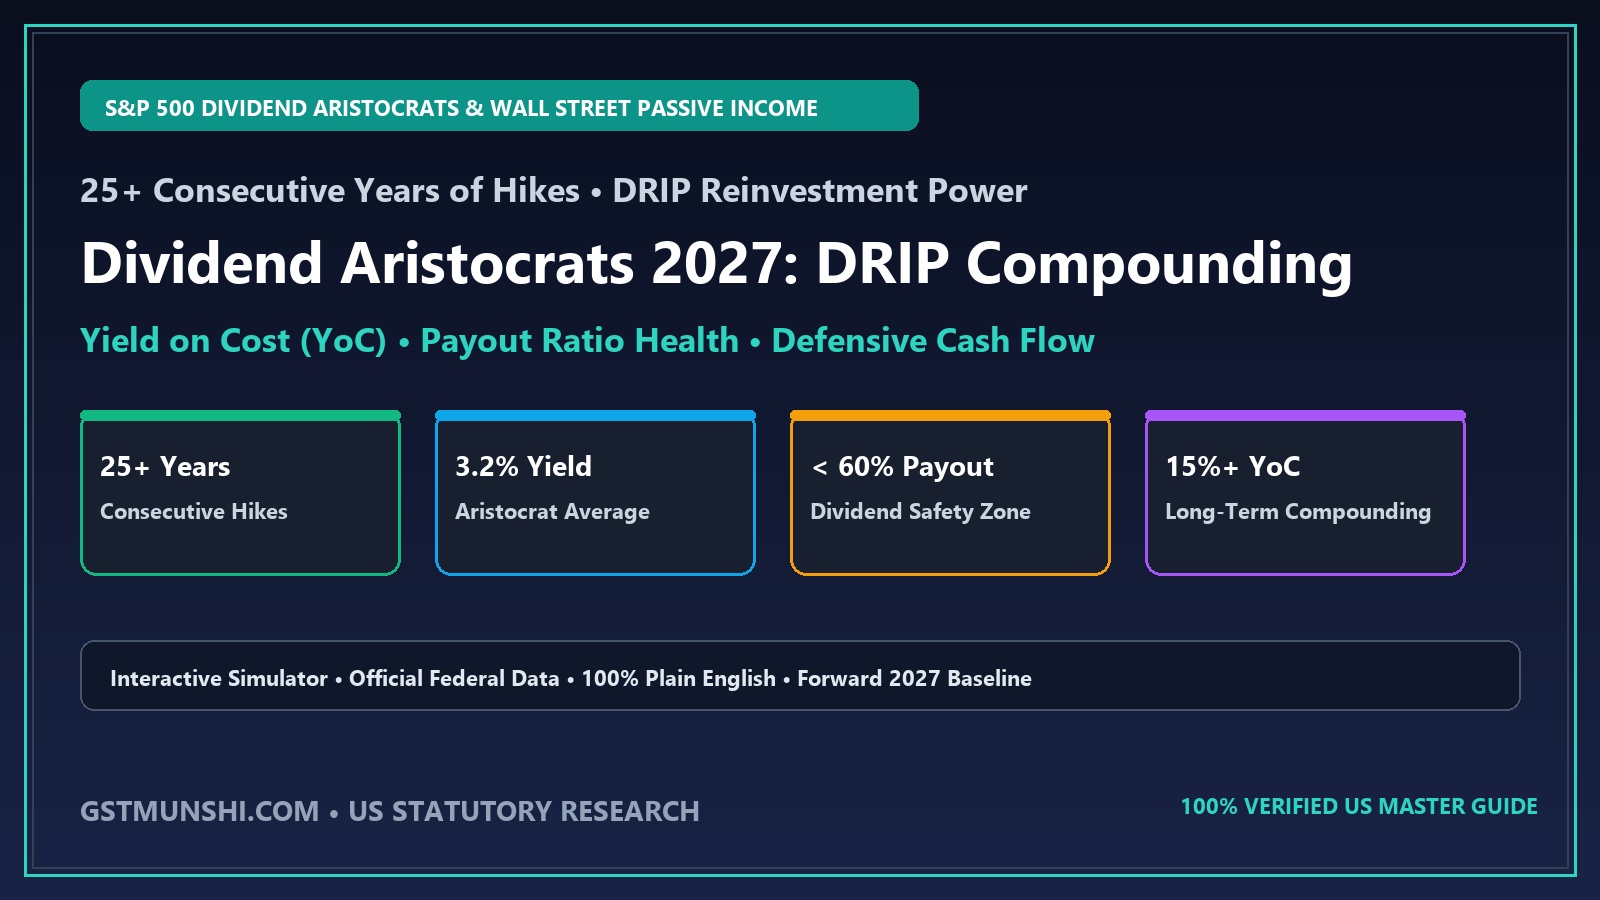
What are S&P 500 Dividend Aristocrats and how does DRIP compounding generate passive income?
An S&P 500 Dividend Aristocrat is an elite blue-chip corporation within the S&P 500 index that has increased its base cash dividend payout every single year for at least 25 consecutive years without interruption. As of 2026–2027, approximately 67 companies hold this prestigious distinction, including Procter & Gamble (PG), Johnson & Johnson (JNJ), Coca-Cola (KO), Abbott Laboratories (ABT), and ExxonMobil (XOM). A Dividend Reinvestment Plan (DRIP) automatically uses quarterly cash distributions to purchase additional fractional shares with zero brokerage commissions. Over a 20- to 30-year horizon, DRIP compounding creates an exponential growth loop, increasing both your share count and Yield on Cost (YoC) well above 15% to 20% on your original invested capital.
Dividend Aristocrats DRIP Compounding & Passive Income Engine
Simulate 25+ year dividend reinvestment growth, annual cash flow, and Yield on Cost (YoC)
DRIP uses quarterly payouts to purchase additional fractional shares with zero transaction commissions.
1The S&P 500 Dividend Aristocrats Criteria & Roster Standards
To join the prestigious S&P 500 Dividend Aristocrats Index (tracked by the ticker NOBL), a company must navigate multiple severe economic recessions, market crashes, interest rate spikes, and global crises while continuing to raise cash payments to shareholders every twelve months. Maintained by S&P Dow Jones Indices, the index enforces four strict quantitative inclusion rules.
First, the corporation must be an active constituent of the S&P 500 index. Second, the company must have increased its regular cash dividend per share for at least 25 consecutive calendar years. Third, the company must maintain a float-adjusted market capitalization of at least $3 billion at each rebalancing date. Fourth, the average daily trading volume must exceed $5 million over the preceding three months to ensure institutional liquidity. Furthermore, the index enforces sector diversification: no single GICS sector can exceed 30% of the total index weight, and the benchmark must maintain a minimum of 40 constituents.
Investors frequently distinguish between Dividend Achievers (10+ years of consecutive hikes), Dividend Aristocrats (25+ years), and Dividend Kings (50+ consecutive years of hikes). Companies like Procter & Gamble, 3M, Dover Corporation, and Emerson Electric have maintained uninterrupted dividend expansion streaks exceeding 60 consecutive years, surviving the 1970s stagflation, the 2000 dot-com bust, the 2008 Great Financial Crisis, and the 2020 pandemic lockdowns.
2The Mathematical Engine of DRIP: Yield on Cost (YoC) Acceleration
The true power of dividend investing is unlocked through a Dividend Reinvestment Plan (DRIP). When you enroll your portfolio in DRIP, your brokerage custodian automatically channels all quarterly dividend cash payments into acquiring additional whole and fractional shares of the underlying stock at the prevailing market price, completely bypassing brokerage transaction commissions.
DRIP creates an automated dollar-cost averaging machine that capitalizes on market volatility. When the stock market crashes or enters a correction, share prices drop, which mechanically causes dividend yields to rise. Under DRIP, your fixed quarterly cash dividend automatically purchases more shares at depressed prices during market selloffs. In the subsequent quarter, those newly acquired shares generate their own dividend distributions, compounding your total equity accumulation exponentially.
This dynamic drives explosive growth in your 'Yield on Cost' (YoC). Yield on Cost measures your current annual dividend income divided by your original capital invested. For example, an investor who purchased shares of Johnson & Johnson or Abbott Laboratories 25 years ago might enjoy a nominal yield of 3.0% today based on current stock prices, but their effective Yield on Cost against their original cash investment frequently exceeds 15% to 25% annually. In retirement, this generates massive, inflation-beating passive cash flow without ever selling a single share of underlying principal.
3Forensic Analysis: Payout Ratios, Free Cash Flow & Dividend Traps
Not all high-yielding dividend stocks are safe. Inexperienced investors frequently fall victim to 'Dividend Traps'—failing companies whose dividend yields look enticingly high (8% to 12%+) solely because their stock price has plummeted due to deteriorating fundamentals, loss of market share, or excessive corporate debt.
To separate rock-solid Dividend Aristocrats from vulnerable traps, Wall Street analysts inspect the Free Cash Flow (FCF) Payout Ratio rather than standard Net Income payout ratios. Because accounting net income includes non-cash items and one-time write-downs, assessing the dividend against operating cash flow minus capital expenditures (FCF) reveals whether the company can afford its dividend using real cash generated by daily operations.
For standard industrial, consumer staples, and healthcare corporations, a payout ratio below 60% of Free Cash Flow represents the golden safety benchmark, leaving ample capital for research, debt reduction, and share buybacks. Payout ratios between 60% and 80% indicate mature cash-cow status, while payout ratios exceeding 85% to 90% signal heightened risk of a dividend freeze or cut. Note that capital-intensive sectors like Real Estate Investment Trusts (REITs) and midstream energy MLPs use specialized metrics (Adjusted Funds from Operations or AFFO) where 80% to 90% payout ratios are standard due to statutory tax pass-through mandates.
4Tax Efficiency: Qualified Dividends vs. Ordinary Income Rules
Understanding the tax treatment of dividend income under Internal Revenue Code § 1(h)(11) is essential for long-term wealth preservation. In the United States, dividends are categorized as either 'Ordinary (Non-Qualified) Dividends' or 'Qualified Dividends.' Ordinary dividends are taxed at your marginal federal income tax bracket (up to 37%), whereas Qualified Dividends are taxed at the substantially lower long-term capital gains rates (0%, 15%, or 20%, plus the 3.8% Net Investment Income Tax for high earners).
Virtually all US-based corporate Dividend Aristocrats pay Qualified Dividends, provided the investor satisfies the statutory holding period rule. Under IRS regulations, you must hold the underlying stock unhedged for more than 60 days during the 121-day window that begins 60 days before the ex-dividend date. Dividends from Real Estate Investment Trusts (REITs, such as Realty Income Corp - O) are generally taxed as ordinary income, though they qualify for the Section 199A 20% Qualified Business Income (QBI) deduction through tax year 2025–2026.
To optimize tax efficiency, investors should execute asset location strategies: hold high-yield ordinary income assets (like REITs and high-yield corporate bonds) inside tax-sheltered accounts like Traditional or Roth IRAs, while placing qualified Dividend Aristocrats with modest yields and high capital growth inside taxable brokerage accounts to benefit from preferential capital gains tax rates and foreign tax credits.
Top S&P 500 Dividend Aristocrats: Streaks, Yields & Payout Safety
| Ticker & Company | GICS Sector | Consecutive Hike Streak | Current Dividend Yield | FCF Payout Ratio | 5-Year Dividend Growth Rate |
|---|---|---|---|---|---|
| PG (Procter & Gamble) | Consumer Staples | 68 Years (King) | 2.4% – 2.7% | 58.2% | 5.8% / year |
| JNJ (Johnson & Johnson) | Healthcare | 62 Years (King) | 3.1% – 3.4% | 54.0% | 5.6% / year |
| KO (Coca-Cola Co.) | Consumer Staples | 62 Years (King) | 2.9% – 3.2% | 68.5% | 4.9% / year |
| ABT (Abbott Laboratories) | Healthcare | 52 Years (King) | 1.9% – 2.2% | 46.8% | 8.5% / year |
| XOM (ExxonMobil Corp.) | Energy | 42 Years | 3.2% – 3.6% | 39.4% | 3.8% / year |
| O (Realty Income Corp.) | Real Estate (REIT) | 30 Years | 5.2% – 5.6% | 75.4% (AFFO) | 3.7% / year |
| MCD (McDonald's Corp.) | Consumer Discretionary | 48 Years | 2.2% – 2.5% | 64.1% | 7.2% / year |
| CAT (Caterpillar Inc.) | Industrials | 31 Years | 1.4% – 1.7% | 29.5% | 8.1% / year |
| ADP (Automatic Data Processing) | Information Technology | 50 Years (King) | 1.9% – 2.1% | 57.3% | 11.2% / year |
| CL (Colgate-Palmolive) | Consumer Staples | 61 Years (King) | 2.0% – 2.3% | 56.8% | 3.9% / year |
20-Year DRIP Compounding Simulation ($25,000 Initial + $500/Month)
| Year Milestone | Total Capital Invested | Portfolio Value (No DRIP) | Portfolio Value (With DRIP) | Annual Dividend Income |
|---|---|---|---|---|
| Year 1 | $31,000 | $32,800 | $33,600 | $1,080 / year |
| Year 5 | $55,000 | $68,500 | $74,200 | $2,750 / year |
| Year 10 | $85,000 | $132,400 | $158,900 | $6,800 / year |
| Year 15 | $115,000 | $228,600 | $312,400 | $15,200 / year |
| Year 20 | $145,000 | $376,500 | $587,300 | $32,800 / year |
Step-by-Step SOP: Building a Resilient Dividend Aristocrat Portfolio
Select Core Core Holdings Across 5+ Non-Correlated Sectors
Construct a diversified portfolio of 15 to 25 Dividend Aristocrats spread across Consumer Staples, Healthcare, Industrials, Utilities, Financials, and Technology to prevent sector concentration risk.
Screen for Free Cash Flow Safety and Debt-to-Equity Ratios
Filter out dividend traps by verifying that every candidate maintains an FCF payout ratio below 65%, an investment-grade credit rating (BBB+ or higher from S&P), and steady operating cash flow.
Activate Automatic DRIP at Your Brokerage Custodian
Enable zero-commission Dividend Reinvestment across your accounts. This automates the purchase of fractional shares every quarter, systematically compounding your share base.
Optimize Tax Placement Across Account Types
Hold REITs and non-qualified dividend payers in Roth or Traditional IRAs. Hold corporate Aristocrats paying qualified dividends in taxable accounts to capitalize on low capital gains tax brackets.
Monitor Quarterly SEC 10-Q Filings for Dividend Declaration Announcements
Check annual dividend hike announcements. If an Aristocrat freezes its dividend for 4 consecutive quarters or announces a dividend reduction, immediately evaluate whether fundamental business deterioration warrants selling.
Official Statutory Rules, Federal Codes & Bar Citations
S&P 500 Dividend Aristocrats Index Methodology
Official rulebook establishing 25-year dividend growth, market cap, and liquidity criteria for NOBL index inclusion.
Internal Revenue Code § 1(h)(11)
Codifies preferential tax rates (0%, 15%, 20%) for qualified dividends paid by domestic and qualifying foreign corporations.
SEC Form 10-K & 10-Q Cash Flow Disclosures
Mandates audited reporting of operating cash flow, capital expenditures, and board-declared dividend cash distributions.
Federal Reserve Board Financial Stability Analysis
Examines corporate cash reserves, dividend payout stability, and debt service ratios across S&P 500 constituents.
Curated Expert Video Walkthroughs & Wall Street Briefings
Frequently Asked Questions (Verified Statutory Answers)
Q1: What is an S&P 500 Dividend Aristocrat?
A Dividend Aristocrat is an S&P 500 company that has increased its base cash dividend payout to shareholders every year for at least 25 consecutive years without interruption. They represent some of the most stable, financially resilient blue-chip corporations in the US economy.
Q2: What is the difference between a Dividend Aristocrat and a Dividend King?
A Dividend Aristocrat must be an S&P 500 constituent with 25+ consecutive years of annual dividend increases. A Dividend King is any publicly traded company (regardless of whether it is in the S&P 500) that has increased its dividend for 50 or more consecutive years.
Q3: How does DRIP (Dividend Reinvestment Plan) work?
A DRIP automatically uses your quarterly cash dividend payments to purchase additional whole and fractional shares of the same stock at market price with zero brokerage commissions, creating a compounding growth loop that increases your share count and future dividend income.
Q4: How are dividends from Dividend Aristocrats taxed in the US?
Most dividends from US corporate Aristocrats qualify as 'Qualified Dividends' under IRC § 1(h)(11), provided you hold the stock for more than 60 days. Qualified dividends are taxed at preferential long-term capital gains rates (0%, 15%, or 20%), which are significantly lower than ordinary income tax rates.
Q5: What is Yield on Cost (YoC)?
Yield on Cost is the annual dividend income you receive divided by your original purchase price (cost basis). As companies increase their dividend payouts each year, your Yield on Cost rises continuously, often exceeding 15% to 20%+ after several decades of holding.
Q6: What is a healthy dividend payout ratio?
For standard corporations, a payout ratio between 40% and 60% of Free Cash Flow is considered optimal and safe. A ratio below 60% indicates the company retains plenty of cash to reinvest in business growth and withstand recessions. Ratios exceeding 85% to 90% warn of possible dividend cuts.
Q7: Can I buy all Dividend Aristocrats in a single ETF?
Yes. The ProShares S&P 500 Dividend Aristocrats ETF (ticker: NOBL) exclusively tracks the Dividend Aristocrats Index by investing equally in every company with a 25+ year dividend growth streak, charging an expense ratio of 0.35%.
Q8: What happens if a Dividend Aristocrat freezes or cuts its dividend?
If a company fails to raise its annual dividend payout or announces a reduction, it is immediately removed from the S&P 500 Dividend Aristocrats Index during the next quarterly rebalancing (as happened historically with AT&T and VF Corp).
Q9: Are high dividend yields (like 8% or 10%) better than 3% yields?
Usually not. Very high yields are often 'dividend traps' where the yield appears inflated only because the company's stock price has plummeted due to financial distress. Aristocrats typically offer sustainable yields between 2.5% and 4.5% backed by consistent dividend growth.
Q10: Do Dividend Aristocrats outperform the S&P 500 index?
Over full market cycles, Dividend Aristocrats have historically delivered total returns comparable to the S&P 500, but with substantially lower volatility (lower beta) and shallower drawdowns during recessions and bear markets.
Q11: Should I hold Dividend Aristocrats in a taxable account or an IRA?
Qualified Dividend Aristocrats can be held tax-efficiently in taxable brokerage accounts because of low 15% qualified dividend tax rates. However, holding them in a Roth IRA is ideal for retirees because all future dividend income and withdrawals are 100% tax-free.
Q12: Can REITs be Dividend Aristocrats?
Yes. S&P 500 Real Estate Investment Trusts like Realty Income Corporation (ticker: O) and Federal Realty Investment Trust (FRT) have increased their dividends for over 25 to 55 consecutive years and qualify as Aristocrats.



Verified X (Twitter) & LinkedIn Expert Insights
“The biggest mistake dividend investors make is sorting a stock screener by dividend yield from highest to lowest. A 10% dividend yield is almost always a flashing warning beacon from the market that a dividend cut is imminent. Companies with 25-year track records like Procter & Gamble or Johnson & Johnson offer 2.5% to 3.5% yields with 50% FCF payout ratios. That modest initial yield grows into a 15%+ yield on cost over 20 years without the catastrophic risk of a capital-destroying dividend cut.”
“During major market drawdowns, Dividend Aristocrats have historically outperformed broad market indices because their cash payouts provide a tangible total-return floor. In 2008 and 2022, companies with pristine balance sheets and 25+ years of dividend hikes fell significantly less than unprofitable growth tech. For retirees living off withdrawals, this lower volatility eliminates the devastating sequence of returns risk.”
“DRIP is the closest thing to legal financial magic in investing. When Coca-Cola or Abbott trades down 15%, your quarterly dividend buys 15% MORE shares. When the market recovers, you own a larger ownership slice producing even more dividends next quarter. Over 25 years, the reinvested dividends account for over 50% of the total return.”
“Don't obsess over today's 3% yield. Focus on Yield on Cost (YoC). If you buy a Dividend Aristocrat hiking payouts at 7% per year, your dividend doubles every 10 years. In 20 years, your yield on your original purchase price is over 12% annually. That is how generational wealth and stress-free retirement income are created.”