GST Munshi Logo
Start Free

Strait of Hormuz Oil Shock: Brent, WTI & S&P 500

Macro energy risk analysis: How Strait of Hormuz crude oil disruptions impact Brent/WTI prices, US gasoline costs, inflation, and S&P 500 stock sectors.

GBy GST Munshi US Quantitative & Statutory Desk•Published: September 2026•15 min read
Audited against US Energy Information Administration (EIA) Chokepoint Reports, NYMEX WTI / ICE Brent Contract Specs & Federal Reserve Inflation Models
Share
Strait of Hormuz Oil Shock: Brent, WTI & S&P 500
WTI & Brent Macro Simulator — Verified US Statutory & Quantitative Analysis ($ USD)
Read in Your Regional Language:
Table of Contents (8 Sections)
Quick Answer & Key Takeaways

How do Strait of Hormuz disruptions and crude oil spikes impact the US stock market?

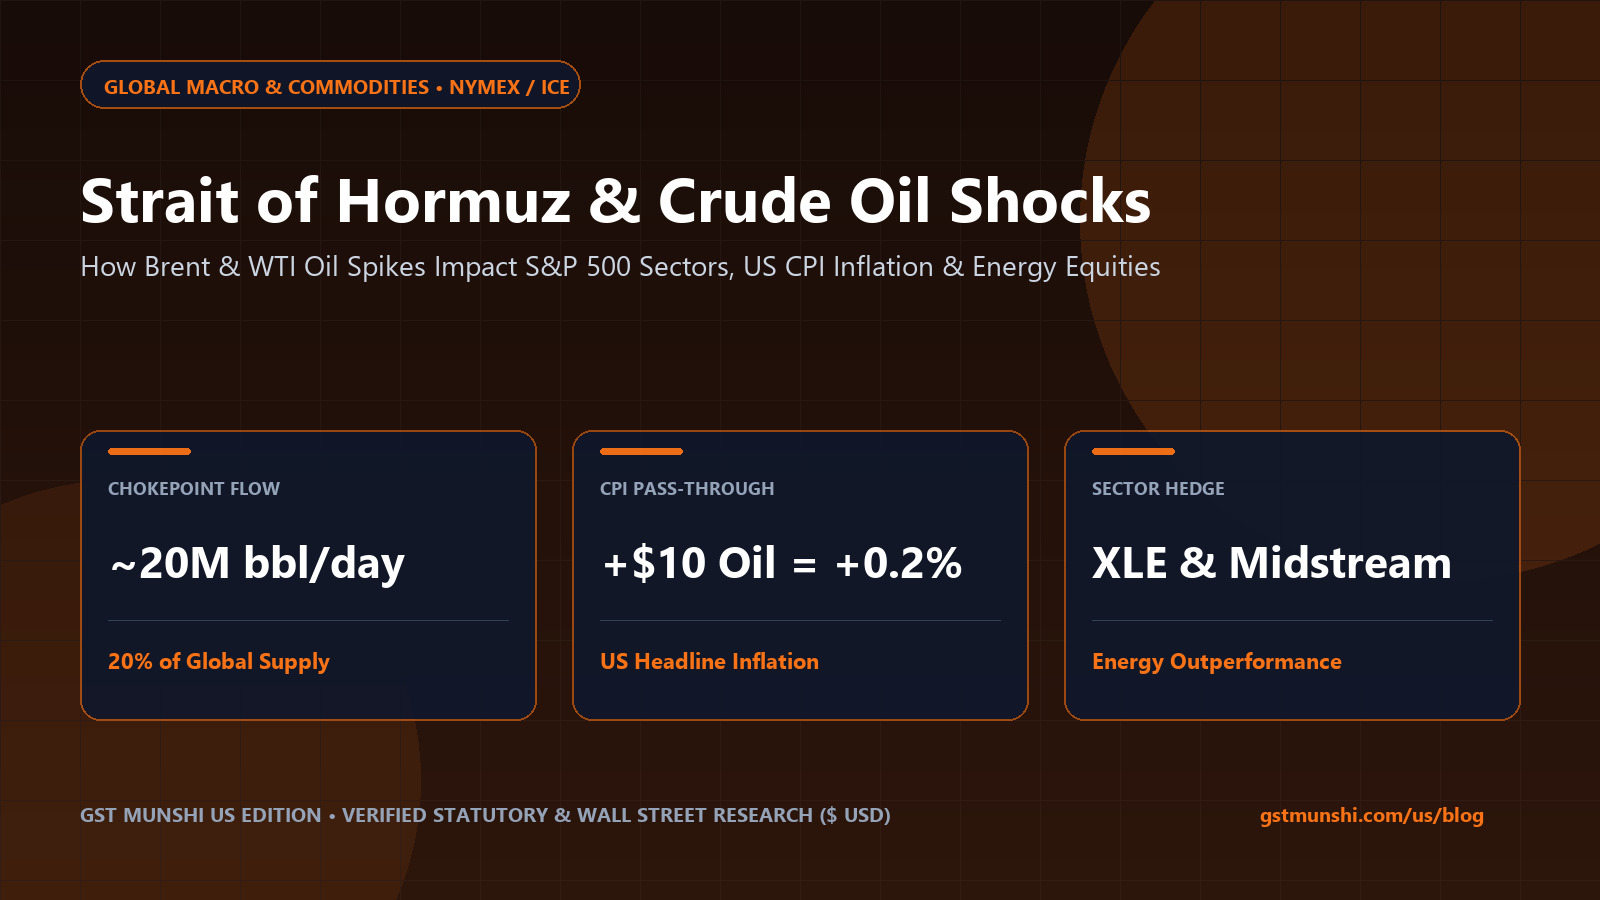
According to the US Energy Information Administration (EIA), roughly 20 million barrels per day—nearly 20% of global petroleum liquids consumption and 20% of global LNG trade—transit the Strait of Hormuz. Every sustained $10/barrel surge in WTI and Brent crude oil adds approximately 0.20% to US headline CPI inflation and $0.25/gallon to retail gasoline prices, pressuring airlines, trucking, and consumer discretionary equities while boosting free cash flow for US Permian Basin producers (XLE) and power infrastructure leaders.

Strait of Hormuz Volume: ~20M barrels/day (world's most critical maritime oil chokepoint)
WTI vs Brent: WTI (Cushing, Oklahoma NYMEX) is the US landlocked benchmark; Brent (North Sea ICE) prices waterborne global crude
Federal Reserve Rule of Thumb: +$10/bbl sustained oil rise adds ~20 bps to headline CPI and reduces US GDP growth by ~0.1%
Beneficiary Sectors: S&P 500 Energy (XLE), Domestic LNG Exporters, and Distributed Power (BE)
Interactive US Financial & Statutory Analyzer ($ USD)
Live Statutory & Quantitative Output
Est. US Headline CPI Impact: +0.20% • Gasoline: ~$3.63/gal

1WTI (West Texas Intermediate) vs Brent Crude: Why the Spread Matters

West Texas Intermediate (WTI) is light, sweet crude oil with an API gravity of ~39.6° and 0.24% sulfur content, delivered physically at Cushing, Oklahoma (NYMEX ticker: /CL). Brent Crude (ICE ticker: /BZ) is a waterborne blend extracted from the North Sea.

When geopolitical tensions escalate in the Persian Gulf or the Strait of Hormuz, waterborne Brent crude typically spikes faster than WTI, widening the Brent-WTI spread and incentivizing maximum US Gulf Coast crude exports.

S&P 500 Sector Sensitivity to a +$20/Barrel Geopolitical Oil Shock

S&P 500 Sector / IndustryEarnings & Margin SensitivityHistorical Relative PerformanceKey Tickers / ETFs
US Upstream E&P & Integrated OilStrongly Positive (+15% to +25% FCF)Top OutperformerXLE, XOM, CVX, COP
Grid-Independent Fuel Cells & PowerPositive (Industrial Energy Security)OutperformerBE, NEE, CEG
Commercial Airlines & Cruise LinesSeverely Negative (Jet Fuel = ~25% OpEx)Sharp UnderperformerJETS, DAL, UAL, AAL
Hyperscale Cloud & SoftwareNeutral Direct Cost / Rate-SensitiveMarket Perform / DefensiveMSFT, AAPL, ORCL, NVDA

4-Step Portfolio Playbook During Geopolitical Energy Shocks

STEP 01

Maintain a 5%–8% Structural Energy & Commodity Ballast

Holding cash-flowing US energy equities (XLE) or midstream pipelines provides a natural positive-carry hedge against inflation spikes.

STEP 02

Monitor the Brent-WTI Spread and US SPR Releases

Track weekly EIA petroleum status reports (published Wednesdays at 10:30 AM ET) alongside Strategic Petroleum Reserve (SPR) policy announcements.

STEP 03

Avoid Chasing Parabolic Geopolitical Gaps on Day 3+

Historical geopolitical oil spikes without physical supply destruction tend to mean-revert within 15–30 trading sessions.

STEP 04

Focus on Core PCE vs Headline CPI for Fed Policy

The Federal Reserve prioritizes Core PCE (which strips out food and energy) unless oil shocks unanchor long-term consumer inflation expectations.

Curated Expert Video Walkthroughs & Wall Street Briefings

Principles by Ray Dalio: How Commodity Shocks & Inflation Impact Central Banks
Watch on YouTube
How Commodity Shocks & Inflation Impact Central Banks
Click to Play Video
How Commodity Shocks & Inflation Impact Central BanksOpen in App
CNBC: Why the Strait of Hormuz is the World's Most Important Oil Chokepoint
Watch on YouTube
Why the Strait of Hormuz is the World's Most Important Oil Chokepoint
Click to Play Video
Why the Strait of Hormuz is the World's Most Important Oil ChokepointOpen in App
CME Group: WTI vs Brent Crude Oil Benchmarks Explained
Watch on YouTube
WTI vs Brent Crude Oil Benchmarks Explained
Click to Play Video
WTI vs Brent Crude Oil Benchmarks ExplainedOpen in App
Bloomberg Television: How Oil Prices Drive Stock Market Sector Rotation
Watch on YouTube
How Oil Prices Drive Stock Market Sector Rotation
Click to Play Video
How Oil Prices Drive Stock Market Sector RotationOpen in App

Frequently Asked Questions (Verified Statutory Answers)

Q1: Why does the US still care about the Strait of Hormuz if America is the world's largest oil producer?

Although the United States produces over 13.2 million barrels per day of crude oil, petroleum is a globally fungible commodity priced on the world margin. A supply disruption in the Persian Gulf raises global Brent prices, which immediately pulls US domestic WTI and retail gasoline prices higher.

Q2: What is the best ETF to track crude oil without K-1 partnership tax forms?

Instead of futures partnerships like USO that issue complex Schedule K-1 tax forms and suffer contango decay, most investors prefer the Energy Select Sector SPDR Fund (XLE), which issues a standard 1099-DIV and pays a ~3.2% qualified dividend yield.
Wall Street Desk • $ USDNASDAQ & NYSE Institutional Equity Research

Analyze 10 Major US Stocks (NVDA, AAPL, MSFT, TSLA, AVGO, ORCL, QCOM, INTC, HPE, BE) in Real $ USD

Complete SEC 10-K/10-Q valuation multiples, DCF fair value models, and multi-agent AI committee ratings.

Share
US

Our US Quantitative & Statutory Research Desk audits every guide against primary federal sources — including SEC EDGAR 10-K/10-Q filings, CBOE Exchange rules, Federal Reserve H.15 rate releases, Social Security Administration (SSA) actuarial tables, CMS Medicare notices, USDA FNS standards, and FDA enforcement reports. All figures are strictly denominated in $ USD.

Related US Master Guides & $ USD Calculators

All US Guides

Questions & Discussion

0 Comments

Have a question or feedback about Strait of Hormuz Oil Shock: Brent, WTI & S&P 500? Ask below. Dedicated discussion thread for this page.

Leave a Comment or Ask a Question
Spam Protected (UGC nofollow) Email is 100% private
All submitted hyperlinks automatically receive rel="nofollow ugc" tags. Zero do-follow backlinks.0 / 2,000

Loading live discussions...

US Institutional Edition • 100% Denominated in $ USD

Explore Live Wall Street Equity Research & Federal Financial Simulators

Access SEC 10-K/10-Q fundamental tearsheets, DCF valuation models, and Multi-Agent AI Committee ratings for top NASDAQ & NYSE stocks (NVDA, AAPL, MSFT, TSLA, AVGO, ORCL, QCOM, INTC, HPE, BE), alongside 18+ statutory US guides on Social Security COLA, Medicare IRMAA, and Federal Reserve mortgage rates.