
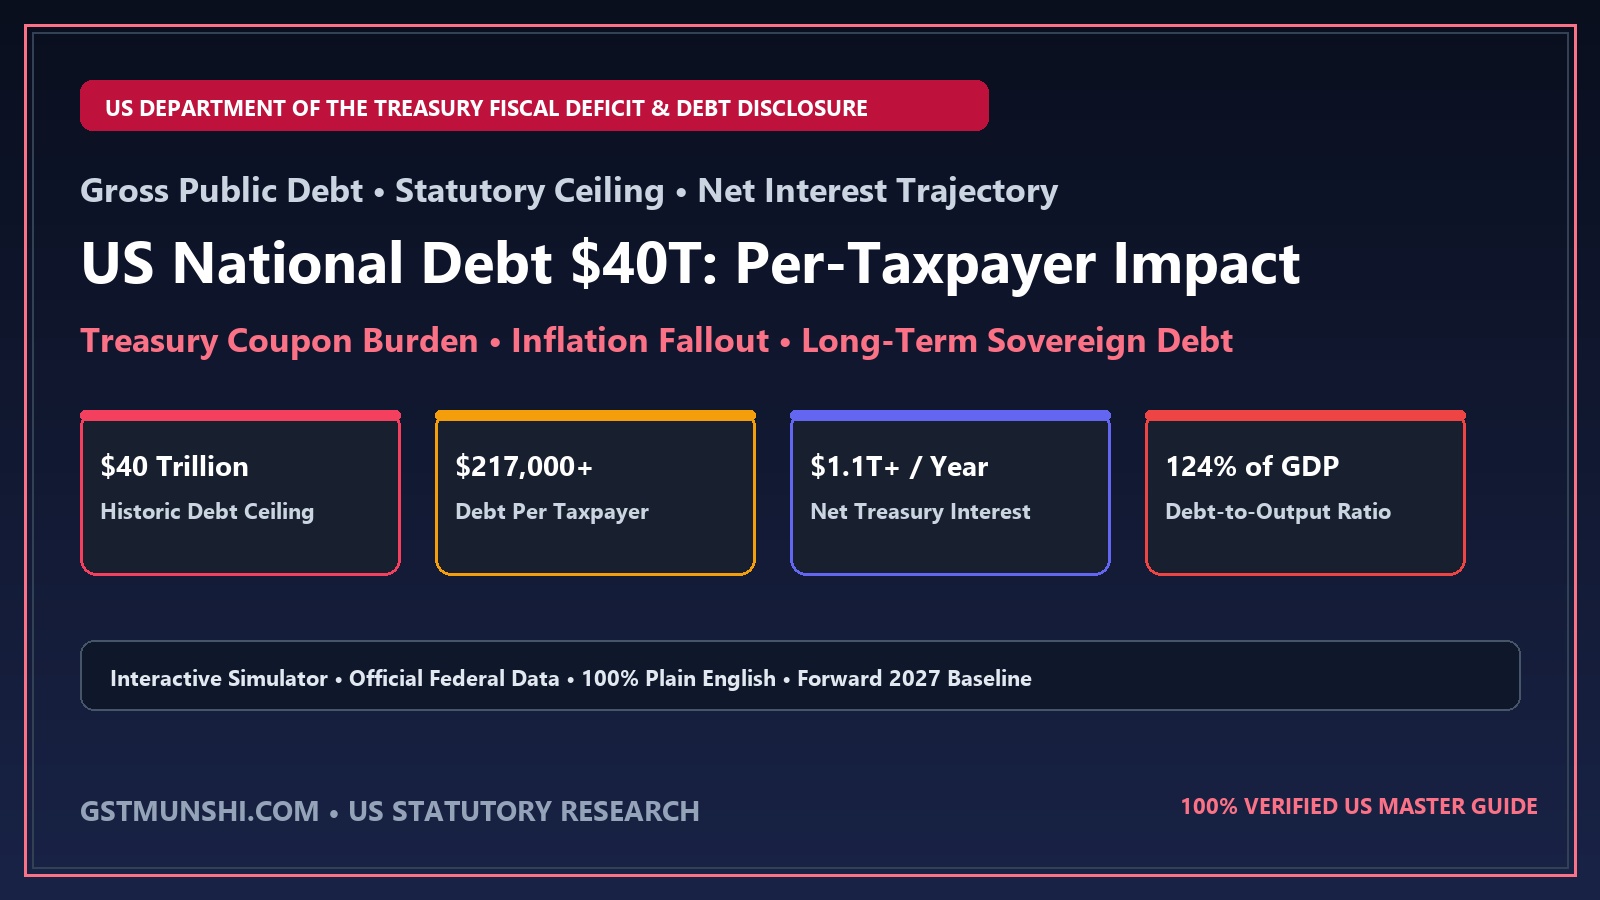
What is the economic impact of the US national debt passing $40 trillion and what is the cost per taxpayer?
As the United States gross national debt crosses the unprecedented $40 trillion milestone, every American taxpayer carries a personal liability exceeding $217,000 (and over $118,000 for every US citizen). Governed by Title 31 of the United States Code (31 U.S.C. § 3101), the national debt now exceeds 124% of Gross Domestic Product (GDP). Due to higher interest rates set by the Federal Reserve, annual net interest payments on Treasury securities have surged above $1.1 trillion per year—surpassing the entire national defense budget. This fiscal dynamic strains federal spending, elevates long-term mortgage rates, and forces recurring debt ceiling showdowns in Congress.
US National Debt $40 Trillion & Per-Taxpayer Liability Simulator
Analyze real-time debt burdens, net Treasury interest expense, and federal fiscal trajectory
1The Mathematical Reality of $40 Trillion: Debt-to-GDP & Fiscal Trajectory
The gross national debt of the United States represents the cumulative total of all annual federal budget deficits accumulated since the founding of the republic. Under the authority of the Second Liberty Bond Act of 1917, codified in Title 31 of the United States Code (31 U.S.C. § 3101), Congress establishes a statutory ceiling on the total face amount of Treasury bonds, bills, and notes that the Department of the Treasury can issue to finance government operations.
As the national debt reaches and breaches the $40 trillion threshold in the 2026–2027 fiscal cycle, the primary metric analyzed by macroeconomic institutions and sovereign credit rating agencies (Moody's, S&P, and Fitch) is the Debt-to-GDP Ratio. Gross debt now stands at approximately 124% of the United States' $32 trillion economy, surpassing the previous historic high of 119% reached in 1946 during the peak mobilization of World War II.
Unlike the post-WWII era—when demobilization, massive industrial expansion, and the post-war baby boom rapidly expanded the tax base and reduced debt-to-GDP to under 35% by the early 1970s—today's debt expansion is structural and permanent. It is driven by aging demographic retirements (triggering mandatory statutory growth in Social Security and Medicare outlays), rising Medicaid healthcare costs, persistent revenue shortfalls, and ballooning interest obligations on existing debt.
2The Net Interest Explosion: How Debt Service Surpassed the Defense Budget
For more than a decade following the 2008 financial crisis, the Federal Reserve maintained near-zero interest rates (Zero Interest Rate Policy or ZIRP), allowing the federal government to borrow trillions of dollars with negligible debt servicing friction. As recently as 2020, annual net interest on the public debt cost less than $350 billion.
However, the Federal Reserve's monetary tightening campaign to combat post-pandemic inflation pushed the effective federal funds rate above 5%. As short-term Treasury bills (T-bills) and benchmark 10-Year Treasury notes roll over into higher coupon yields (3.8% to 4.5%), the cost to service the national debt has exploded exponentially. For the 2026–2027 fiscal year, net interest on the public debt exceeds $1.15 trillion annually, absorbing over 16% of all federal tax revenues.
This dynamic produces a historic fiscal milestone: the US federal government now spends more money paying interest to Treasury bondholders than it spends on the entire United States Department of Defense ($880 billion), and more than all federal spending on veterans' healthcare, education, transportation infrastructure, and Homeland Security combined. Every dollar consumed by net interest is deadweight financial friction—it builds no roads, funds no medical cures, and provides zero public services.
3Who Owns the US National Debt? Debunking Foreign Ownership Myths
A pervasive public myth is that foreign nations—most notably China—own the vast majority of America's sovereign debt and hold the power to collapse the US economy overnight. Empirical data from the Treasury Department's Treasury International Capital (TIC) reports completely refutes this misconception.
The largest single owner of US government debt is the American public itself and intragovernmental trust funds. Intragovernmental debt accounts for approximately $7.2 trillion held in statutory government trust funds, primarily the Social Security Old-Age and Survivors Insurance (OASI) Trust Fund, Military Retirement Fund, and Civil Service Retirement System. Another $18 trillion is held by domestic institutional investors: private pension funds, life insurance companies, mutual funds, 401(k) retirement accounts, state and local municipal governments, and commercial banks.
Foreign investors and central banks hold approximately $8.5 trillion (roughly 22% of total debt). The largest foreign holder of US Treasuries is Japan (holding approximately $1.1 trillion), followed by the United Kingdom ($740 billion). China, which held over $1.3 trillion in Treasuries a decade ago, has systematically trimmed its holdings to approximately $750 billion as it diversifies reserves into physical gold and non-dollar assets. Global investors continue to hold Treasuries because the US dollar remains the world's primary reserve currency and the US Treasury market is the deepest, most liquid financial asset market on earth.
4Debt Ceiling Crises, Extraordinary Measures & Impact on Average Citizens
The statutory debt limit is not an authorization for new spending; rather, it is a legal restriction on the Treasury's ability to borrow money to pay for expenditures already enacted by bipartisan legislation in Congress. When the debt ceiling is reached, the Secretary of the Treasury is forced to deploy 'Extraordinary Measures'—such as suspending new investments in the Thrift Savings Plan Government Securities (G-Fund) and the Postal Service Retiree Health Benefits Fund—to prevent a sovereign default.
If Congress fails to raise or suspend the debt limit before Treasury cash reserves (the Treasury General Account at the Federal Reserve) are depleted, the United States faces an catastrophic technical sovereign default. Financial institutions warn that a US default would instantly trigger a global market crash, freeze short-term repo funding markets, spike mortgage rates by 1.5% to 2.5%, and delay Social Security and veterans' disability checks.
For everyday citizens, the real consequence of sustained $40 trillion debt is subtle but destructive: Crowding-Out and Inflation. Massive Treasury bond issuance forces the federal government to compete with corporations and homebuyers for private capital, keeping benchmark yields elevated. This directly drives higher borrowing costs for consumer auto loans, credit card APRs (averaging over 21%), and 30-year fixed mortgages, diminishing middle-class purchasing power and living standards.
Ownership Breakdown of the US Gross Public Debt ($40 Trillion Horizon)
| Debt Holder Category | Total Amount Held | Percentage of Total Debt | Primary Entities / Institutional Examples |
|---|---|---|---|
| US Intragovernmental Trust Funds | $7.2 Trillion | 18.0% | Social Security Trust Funds, Military Retirement, Civil Service FERS |
| Federal Reserve System (Fed SOMA) | $4.8 Trillion | 12.0% | Federal Reserve System Open Market Account (Quantitative Easing assets) |
| US Private Institutional Investors | $10.5 Trillion | 26.25% | Vanguard, BlackRock, pension funds, 401(k) accounts, insurance companies |
| US Commercial Banks & State/Local Govs | $4.5 Trillion | 11.25% | JPMorgan, Bank of America, state municipal rainy day reserves |
| Foreign Entities: Japan | $1.12 Trillion | 2.8% | Bank of Japan, Japanese institutional pension funds (Largest foreign holder) |
| Foreign Entities: China | $0.75 Trillion | 1.88% | People's Bank of China (Steadily declining from peak $1.3T) |
| Foreign Entities: UK, Canada, Eurozone & Others | $6.63 Trillion | 16.57% | Global central banks, sovereign wealth funds (Norway, Saudi, UAE) |
| US Retail Investors & TreasuryDirect | $4.5 Trillion | 11.25% | Series I-Bonds, EE Savings Bonds, individual Treasury bills/notes |
Federal Budget Outlay Comparison: Net Interest vs. Major Mandatory Programs
| Federal Budget Category | Projected Annual Outlay (2026–2027) | Share of Federal Budget | Mandatory vs. Discretionary |
|---|---|---|---|
| Social Security (OASI & Disability) | $1.62 Trillion | 23.5% | Mandatory Statutory Program |
| Medicare (Parts A, B, C & D) | $1.18 Trillion | 17.1% | Mandatory Statutory Program |
| Net Interest on Public Debt | $1.15 Trillion | 16.7% | Mandatory Sovereign Contract Obligation |
| National Defense (DOD & Nuclear) | $0.88 Trillion | 12.8% | Discretionary Congressional Appropriation |
| Medicaid & CHIP Outlays | $0.62 Trillion | 9.0% | Mandatory Federal/State Partnership |
| Veterans' Benefits & Healthcare | $0.34 Trillion | 4.9% | Discretionary / Mandatory Benefits |
| All Other Federal Agency Operations | $1.11 Trillion | 16.0% | Discretionary (Education, EPA, NASA, Justice) |
Step-by-Step Blueprint: How Individual Investors Can Hedge Against Sovereign Debt Expansion
Diversify Beyond US Dollar Cash and Nominal Fixed-Rate Bonds
Excessive national debt increases long-term inflation risk. Avoid holding excessive cash in standard checking accounts; deploy capital into productive equity assets that maintain pricing power.
Allocate to Treasury Inflation-Protected Securities (TIPS) and I-Bonds
Protect a portion of your fixed-income portfolio with Treasury TIPS and Series I Savings Bonds, whose principal balances adjust semi-annually based on CPI-U inflation metrics.
Acquire Hard Assets and Real Property with Fixed-Rate Debt
Real estate with long-term 30-year fixed-rate mortgages serves as an exceptional structural hedge against debt monetization: debt is repaid in future deflated dollars while property values appreciate.
Maintain Moderate Exposure to Monetary Hedges (Gold & Global Assets)
Allocate 5% to 10% of portfolio assets into physical gold, precious metals, or international ex-US equity index funds (VXUS) to insulate your net worth against long-term US dollar purchasing power dilution.
Lock In Long-Term Low-Cost Fixed Financing Immediately
Anticipate sustained upward pressure on benchmark borrowing costs. Refinance variable-rate credit cards and personal loans into fixed-rate structures to insulate cash flow from Treasury yield spikes.
Official Statutory Rules, Federal Codes & Bar Citations
Title 31 United States Code § 3101 (Public Debt Limit)
Statutory authority establishing the aggregate limit on face amount of obligations issued by the Secretary of the Treasury.
Congressional Budget Office (CBO) Long-Term Budget Outlook
Authoritative 30-year baseline projections of federal revenues, outlays, public debt, and economic growth trajectories.
Treasury International Capital (TIC) System
Monthly audited census quantifying foreign holdings of US Treasury bills, notes, bonds, and corporate securities.
Daily Treasury Statement (DTS) & Debt to the Penny
Official accounting ledger publishing exact daily public debt figures, operating cash balances, and borrowing totals.
Curated Expert Video Walkthroughs & Wall Street Briefings
Frequently Asked Questions (Verified Statutory Answers)
Q1: What is the US national debt and how does it reach $40 trillion?
The US national debt is the total amount of money the federal government has borrowed to cover the accumulation of annual budget deficits over US history. It passes $40 trillion due to ongoing annual deficits of $1.5 to $2.0 trillion driven by mandatory entitlement spending, defense budgets, tax cuts, and soaring interest payments on existing debt.
Q2: How much of the US national debt does each taxpayer owe?
Across approximately 168 million federal income tax filers, a $40 trillion national debt represents a liability of over $217,000 per taxpayer. Across the total US population of 337 million citizens, the debt equals approximately $118,000 per person.
Q3: How much interest does the US government pay on the national debt every year?
Annual net interest payments on the public debt exceed $1.15 trillion per year, which equates to more than $3.1 billion every single day (over $130 million per hour) paid to domestic and international Treasury bondholders.
Q4: Does China own most of the US national debt?
No. China holds approximately $750 billion of US Treasuries, which is less than 2% of the total $40 trillion debt. The largest foreign holder of US debt is Japan ($1.12 trillion). Roughly 78% of the US national debt is owned by domestic American institutions, intragovernmental trust funds (like Social Security), pension funds, and private citizens.
Q5: Can the US government go bankrupt or default on its debt?
Because the United States borrows in its own sovereign fiat currency (the US dollar) and has the constitutional power to tax and print currency, a true involuntary financial bankruptcy is virtually impossible. However, the government can experience a catastrophic 'technical default' if Congress refuses to raise the statutory debt ceiling before the Treasury runs out of cash.
Q6: What is the statutory debt ceiling?
Codified in 31 U.S.C. § 3101, the debt ceiling is a legal limit set by Congress on the maximum amount of money the US Treasury can borrow. When the ceiling is reached, the Treasury cannot issue new bonds and must rely on 'extraordinary measures' and incoming daily tax revenues to pay existing legal obligations.
Q7: How does the national debt affect everyday Americans?
A soaring national debt keeps benchmark interest rates elevated, leading to higher mortgage rates (keeping 30-year loans around 6.5%–7%), higher auto loan payments, and credit card APRs over 21%. It also increases long-term inflation risk and threatens future cuts or tax increases for programs like Social Security and Medicare.
Q8: Why doesn't the government just print $40 trillion to pay off the debt?
Printing $40 trillion out of thin air would flood the economy with cash without creating any new goods, services, or economic output, instantly causing runaway hyperinflation that would destroy the value of the US dollar, wipe out people's lifetime savings, and collapse global trade.
Q9: What is the Debt-to-GDP ratio and why does it matter?
The Debt-to-GDP ratio measures total sovereign debt against the total annual economic output of the nation. At $40 trillion, the US ratio is approximately 124% of GDP. Economic studies show that sustained debt-to-GDP ratios above 90% tend to slow long-term economic growth by crowding out private business investment.
Q10: What is the difference between the national debt and the federal deficit?
The federal deficit is the shortfall in a single fiscal year when government spending exceeds tax revenues (e.g., an annual deficit of $1.8 trillion). The national debt is the cumulative total of all annual deficits minus surpluses over the nation's entire history.
Q11: How does the US government borrow money?
The US Department of the Treasury auctions marketable debt securities to investors, banks, and foreign central banks. These securities include short-term Treasury Bills (T-bills, maturing in 4 to 52 weeks), medium-term Treasury Notes (maturing in 2 to 10 years), and long-term Treasury Bonds (maturing in 20 or 30 years).
Q12: How can individual investors protect their money against national debt expansion?
Investors can hedge by holding diversified broad-market equities (S&P 500 index funds) that possess pricing power, owning real estate with low fixed-rate mortgages, investing in Treasury Inflation-Protected Securities (TIPS) and Series I Savings Bonds, and holding modest allocations in physical gold and international assets.












Verified X (Twitter) & LinkedIn Expert Insights
“The biggest long-term macroeconomic reality is that we are in the late stage of the long-term debt cycle. When debt reaches $40 trillion and net interest exceeds $1 trillion annually, the government has to issue more debt just to pay the interest on the old debt. When supply of debt outstrips private demand, the central bank is eventually forced to either accept painful interest rate spikes or step in and print money to buy the debt, eroding the purchasing power of the currency.”
“Crossing $40 trillion is not just a psychological milestone; it is an economic turning point. For the first time in peacetime history, net interest on the debt is consuming more federal revenue than the entire United States military. We are spending $1.1 trillion every year on our past spending, leaving zero fiscal headroom to invest in future education, infrastructure, or clean energy.”
“The Treasury has to refinance roughly $9 trillion in maturing sovereign debt this fiscal year alone, plus issue another $1.8 trillion in new debt to cover the deficit. That means over $10 trillion in Treasury paper hitting the market. Unless private buyers step up, bond yields will stay structurally higher for longer. The era of cheap borrowing is over.”
“When government debt-to-GDP passes 120%, monetary policy loses its normal traction—we enter 'Fiscal Dominance.' Raising interest rates actually increases the federal deficit by pumping billions of extra interest income into the private sector from Treasury coupon payments. In this environment, hard assets and sound capital allocation are essential.”