What is the CBOE Volatility Index (VIX) and how does it predict S&P 500 swings?
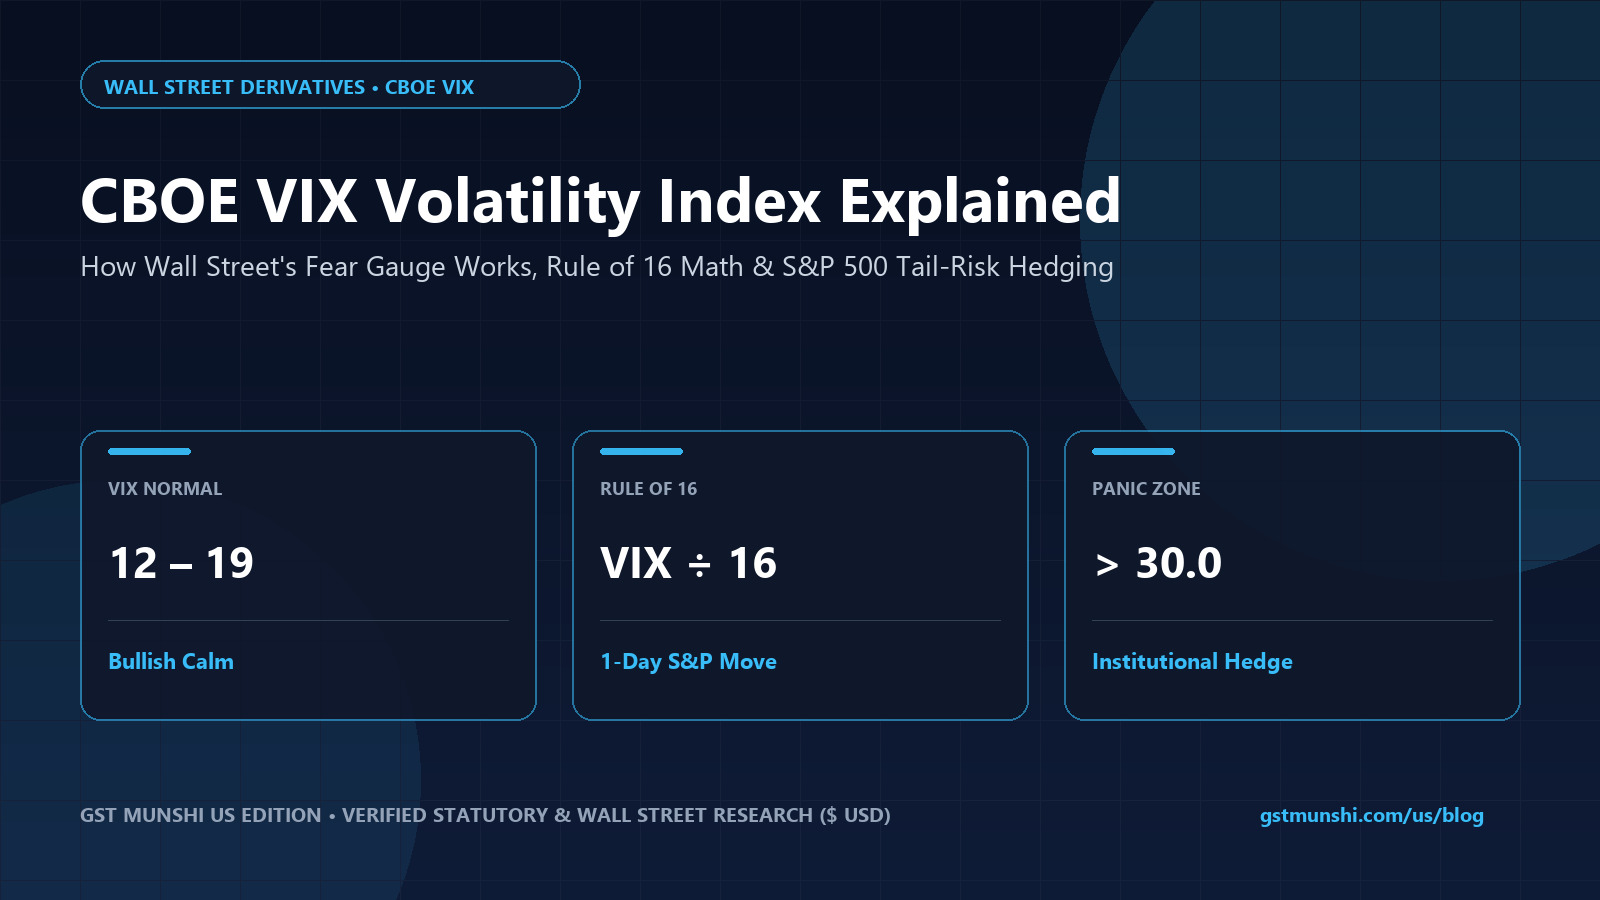
The CBOE Volatility Index (VIX) measures the market's real-time expectation of 30-day forward annualized volatility in the S&P 500 Index (SPX), derived from out-of-the-money SPX put and call option prices across standard Friday and weekly expirations. Using Wall Street's 'Rule of 16' (dividing VIX by √252 ≈ 15.87), a VIX reading of 16 implies a 1-standard-deviation daily S&P 500 move of ±1.00%, whereas a VIX spike to 32 signals ±2.00% daily market swings.
CBOE VIX "Rule of 16" Implied S&P 500 Swing & Hedge Budget Calculator
Enter the current CBOE VIX index reading and your US equity portfolio value in $ USD to compute the 1-standard-deviation (68.2% probability) daily, weekly, and 30-day S&P 500 dollar swing.
1How the CBOE VIX Index is Calculated from S&P 500 Options
Unlike equity indices such as the S&P 500 or NASDAQ-100 that track the market capitalization of underlying corporations, the Cboe Volatility Index (VIX) is a variance swap benchmark. It aggregates the weighted prices of out-of-the-money (OTM) S&P 500 Index (SPX) call and put options with more than 23 days and less than 37 days to expiration.
When institutional pension funds, hedge funds, and market makers rush to buy SPX put options to insure their portfolios against macroeconomic shocks or Federal Reserve policy surprises, option implied volatility surges—driving the VIX sharply higher even before spot equities bottom.
- Annualized Standard Deviation: A VIX of 20 means the options market prices a 68.2% probability (1σ) that the S&P 500 will trade within ±20% over the next 12 months.
- Contango vs Backwardation: Roughly 80% of the time, the VIX futures curve trades in contango (longer-dated /VX futures trade higher than spot VIX), causing long volatility ETFs like VIXY and UVXY to suffer severe roll decay if held long-term.
2Institutional Portfolio Hedging: SPX Put Spreads vs VIX Call Options
For retail and institutional investors holding concentrated US technology and S&P 500 positions (such as VOO, QQQ, NVDA, AAPL, and MSFT), the most capital-efficient tail-risk hedge during low-VIX regimes (<16) is a 60-to-90-day out-of-the-money SPX put debit spread or a zero-cost equity collar.
CBOE VIX Volatility Regime Matrix & Institutional Playbook
| VIX Level Band | Implied 1-Day S&P 500 Swing | Market Psychology Regime | Optimal Institutional Strategy |
|---|---|---|---|
| 10.0 – 14.9 | ±0.63% to ±0.94% | Complacency / Low-Vol Grind | Accumulate 60–90 DTE protective SPX put spreads |
| 15.0 – 19.9 | ±0.95% to ±1.25% | Healthy Bullish Expansion | Maintain core equity allocation; sell covered calls on spikes |
| 20.0 – 29.9 | ±1.26% to ±1.88% | Elevated Macro Uncertainty | Deploy zero-cost equity collars; trim high-beta leverage |
| 30.0 – 45.0+ | ±1.89% to ±2.83%+ | Capitulation & Forced Liquidation | Monetize VIX/put hedges; scale into S&P 500 & NASDAQ-100 quality |
4-Step Blueprint to Hedge a $100,000+ US Stock Portfolio
Measure Portfolio Beta Against S&P 500
Calculate your portfolio's beta-weighted delta relative to SPY or QQQ. A tech-heavy portfolio holding NVDA and TSLA often carries a 1.4x–1.6x beta to the S&P 500.
Compute Implied Range via the Rule of 16
Divide the live VIX level by 16 to determine whether daily market swings exceed normal historical variance.
Structure Put Spreads Instead of Holding Leveraged VIX ETFs
Avoid holding UVXY or VIXY for months due to daily contango roll drag. Use defined-risk SPY or QQQ put debit spreads 5%–15% out-of-the-money.
Monetize Protection When VIX Crosses 30+
Volatility is strictly mean-reverting. Harvest gains on protective puts during VIX backwardation spikes (>30) and rebalance into undervalued equities.
Curated Expert Video Walkthroughs & Wall Street Briefings


Frequently Asked Questions (Verified Statutory Answers)
Q1: Can I buy the VIX Index directly in my US brokerage account?
No. Spot VIX is a mathematical statistic, not a deliverable asset. Investors gain exposure through Cboe VIX futures (/VX), VIX options, or exchange-traded products that hold VIX futures such as ProShares VIX Short-Term Futures ETF (VIXY).
Q2: Why do VIX ETFs like VIXY and UVXY lose value over the long run?
Because VIX futures trade in contango roughly 80% of trading days, VIX ETFs must continually sell cheaper expiring front-month futures and buy more expensive second-month futures, creating a structural negative roll yield of 3%–7% per month during calm markets.
Q3: How are VIX options and SPX index options taxed by the IRS?
Cash-settled broad-based index options (SPX and VIX) qualify as Section 1256 Contracts under the Internal Revenue Code, receiving favorable 60% Long-Term / 40% Short-Term capital gains tax treatment regardless of holding period.