How do you read an El Niño winter snowfall forecast map and NOAA probability contours?
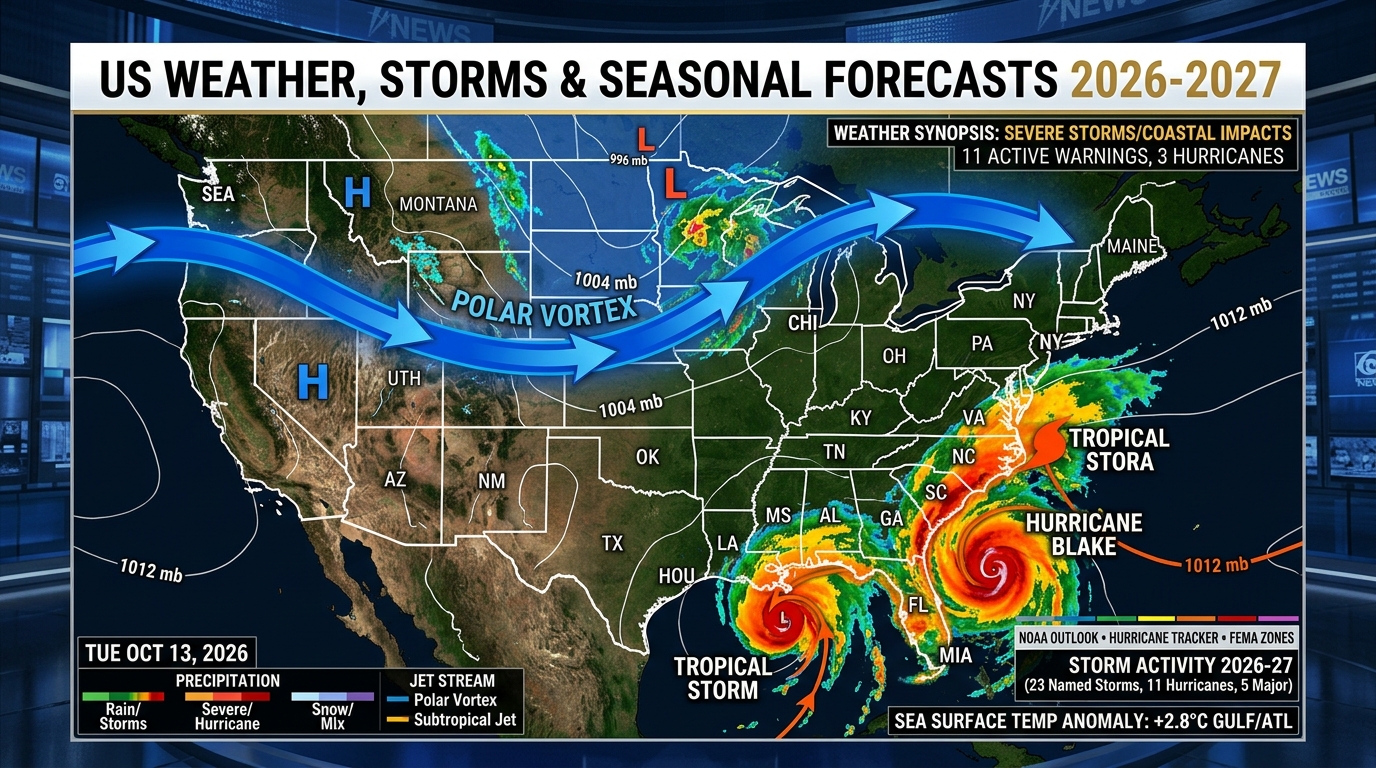
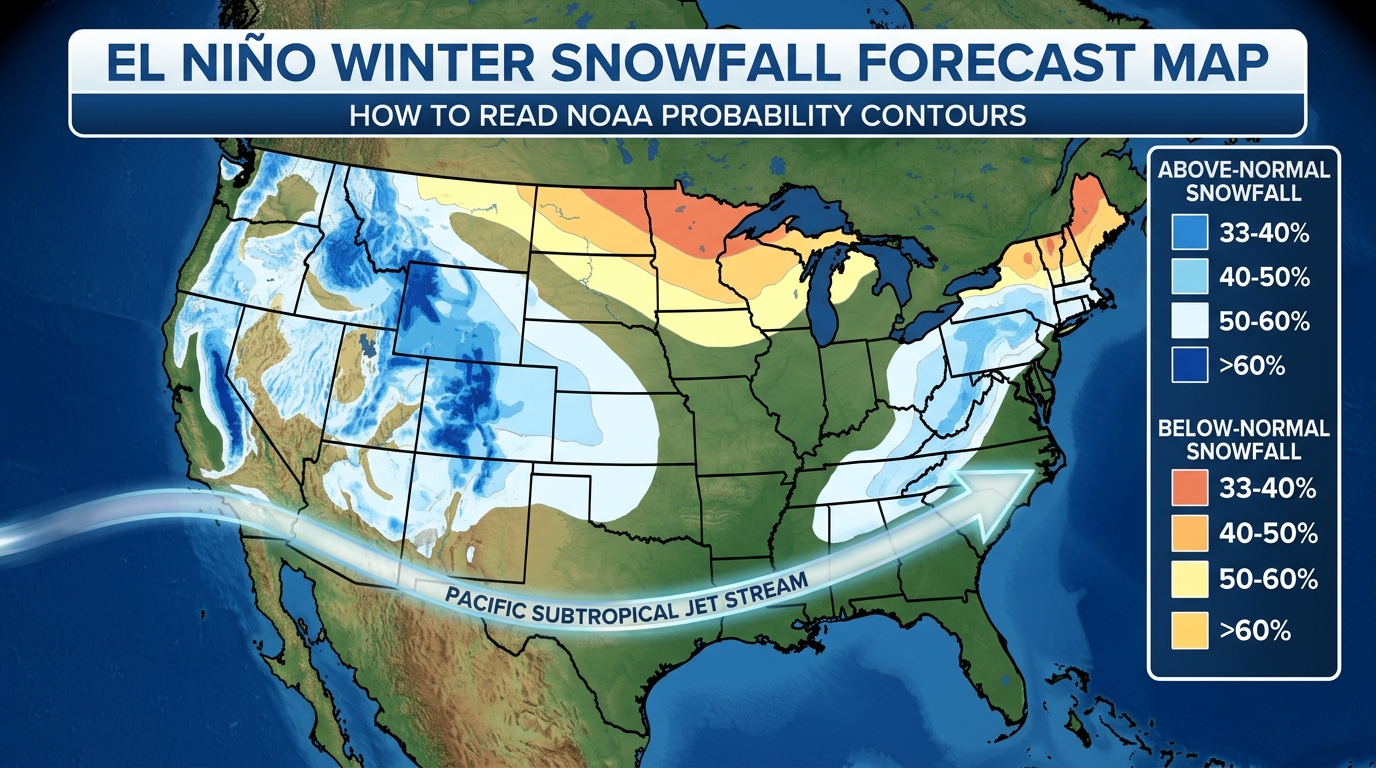
An El Niño winter snowfall forecast map displays percentage anomalies relative to the 30-year climatological average (1991–2020), not guaranteed inch totals. During El Niño, an energized subtropical jet stream increases snowfall across the Southern Rockies, Four Corners, Central Plains, and Mid-Atlantic while leaving the Pacific Northwest, Northern Rockies, and Great Lakes drier and milder.
Interactive El Niño vs. La Niña US Winter Snowfall & Jet Stream Decoder
Toggle between El Niño, ENSO Neutral, and La Niña phases across 7 US regions to see how Pacific sea-surface temperature anomalies shift winter snowfall contours and Atlantic hurricane shear.
1How to Decode NOAA CPC Probability Contours (Above, Near, and Below Normal)
One of the most widespread misconceptions in consumer meteorology occurs when viewers mistake the shaded colors on a National Oceanic and Atmospheric Administration (NOAA) Climate Prediction Center (CPC) winter map for snow depth predictions. Operational NOAA seasonal maps do not forecast specific snowfall inches. Instead, they map the statistical probability that seasonal precipitation or temperature will fall into one of three historical buckets—known as terciles—based on the 1991–2020 30-year climate normal.
Under baseline climatology with no predictive signal, any given winter has a 33.3% chance of being 'Below Normal' (dry/cold), a 33.3% chance of being 'Near Normal', and a 33.3% chance of being 'Above Normal' (wet/warm). When a region is shaded green with a 50% Above Normal precipitation contour on an El Niño winter outlook map, it signifies a 50% probability of finishing in the top third wettest winters, a 33% probability of finishing near normal, and only a 17% probability of finishing in the driest third.
To convert precipitation probability into actual snowfall expectations, meteorologists overlay two datasets: the 90-day precipitation anomaly map and the 850-millibar (roughly 5,000 feet altitude) temperature anomaly map. Regions where Above Normal precipitation overlaps with Below Normal or Near Normal sub-freezing temperatures represent the highest-confidence winter snow corridors.
- EC (Equal Chances) White Zones: Does not mean 'normal snowfall'—it means climate models show equal 33.3% odds for above, near, or below average snow.
- 10:1 vs. 15:1 Snow-to-Liquid Ratio (SLR): One inch of liquid-equivalent winter precipitation equals roughly 10 inches of wet coastal snow or 15+ inches of dry powdery Rocky Mountain snow.
- Niño 3.4 Oceanic Niño Index (ONI): The official NOAA threshold requires a 3-month running mean SST anomaly of +0.5°C or higher in the east-central equatorial Pacific.
2El Niño Subtropical Jet Stream Mechanics & Regional Snowfall Winners
During an El Niño winter, trade winds across the tropical Pacific weaken or reverse, allowing warm ocean water to pool from the International Date Line eastward toward South America. Deep tropical thunderstorms erupt over these abnormally warm waters, pumping heat and momentum into the upper troposphere. This thermal forcing strengthens and extends the subtropical jet stream across Baja California, Texas, the Gulf Coast, and up the Atlantic Seaboard.
Because the subtropical jet stream acts as a conveyor belt for Pacific and Gulf of Mexico moisture, storms track much farther south than usual. When one of these moisture-laden southern lows phases with a high-pressure cold dome over New England and southeastern Canada, it rapidly intensifies off the Carolina and Virginia capes (a Miller Type-A coastal cyclogenesis pattern). This exact setup produced the historic Mid-Atlantic blizzards of February 2010 ('Snowmageddon' in Washington, D.C. and Baltimore) and January 2016 ('Jonas') during strong El Niño winters.
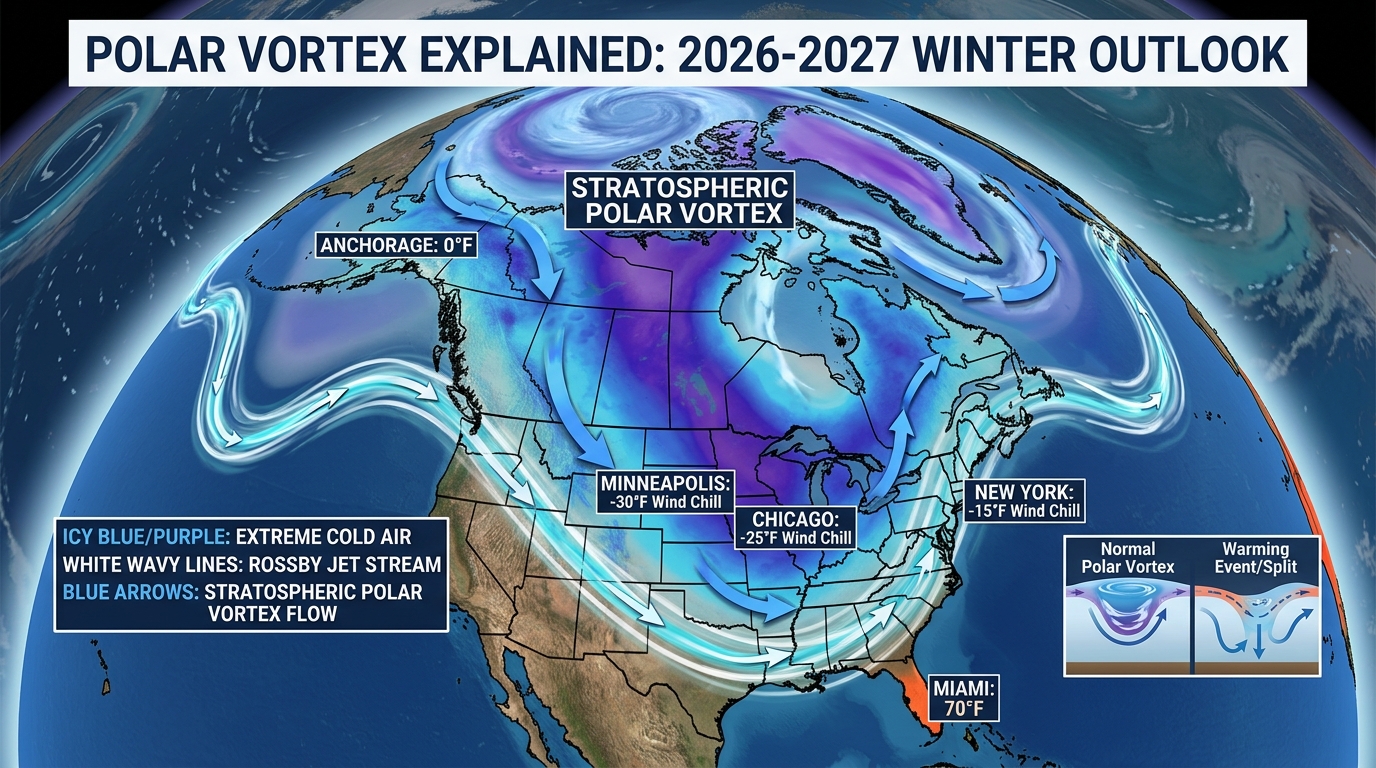
Conversely, the polar jet stream splits and retreats into central Canada during classic El Niño winters. As a result, Seattle, Portland, Boise, Missoula, Minneapolis, and Detroit frequently experience mild Pacific chinook winds, reduced Alberta Clipper frequency, and snowfall deficits of 20% to 40% below their 30-year baseline.
3Weak El Niño vs. Strong 'Super' El Niño Snowfall Map Differences
Not all El Niño winters behave identically on a snowfall map. Historical composite analysis from NOAA's Physical Sciences Laboratory (PSL) spanning 1950 to 2026 reveals a dramatic divergence between Weak El Niño winters (ONI +0.5°C to +0.9°C) and Strong El Niño winters (ONI ≥ +1.5°C).
In a Strong El Niño, warm Pacific maritime air floods almost the entire northern tier of the United States, shutting down snow production in the Midwest and interior Northeast except during rare coastal bombs. In a Weak El Niño, however, the subtropical jet remains active while the polar vortex is more easily disrupted, allowing abundant Arctic cold air to remain in place over the Mid-Atlantic, Ohio Valley, and Southern Plains. Consequently, weak-to-moderate El Niño winters historically deliver the highest total snowfall for cities like Denver, Amarillo, Kansas City, St. Louis, Washington D.C., Philadelphia, and New York City.
El Niño Intensity vs. US Regional Winter Snowfall Anomaly Matrix (1950–2026 Composite)
| US Snowfall Region | Weak El Niño (+0.5°C to +0.9°C) | Moderate El Niño (+1.0°C to +1.4°C) | Strong El Niño (+1.5°C+) | Dominant Storm Track Type |
|---|---|---|---|---|
| Mid-Atlantic (DC, Baltimore, Philly) | +35% to +55% Above Avg | +25% to +45% Above Avg | +15% to +30% (Boom or Bust) | Miller Type-A Coastal Nor'easter |
| Four Corners & S. Rockies (CO, NM, AZ) | +15% to +25% Above Avg | +25% to +40% Above Avg | +30% to +50% Above Avg | Four Corners Cutoff Low / Upslope |
| Sierra Nevada & California Mountains | Near Normal (-5% to +10%) | +15% to +30% Above Avg | +35% to +65% Above Avg | Pineapple Express Atmospheric River |
| Pacific Northwest & Cascades (WA, OR) | -15% to -25% Below Avg | -25% to -35% Below Avg | -30% to -45% Below Avg | Split Flow / Ridge Over NW |
| Upper Midwest & Great Lakes (MN, WI, MI) | -10% to -20% Below Avg | -20% to -35% Below Avg | -35% to -55% Below Avg | Suppressed Clipper Track / Warm Lake |
How to Read & Verify Any Winter Snowfall Forecast Map in 4 Steps
Check the Current NOAA ONI Value in the Niño 3.4 Region
Verify whether the equatorial Pacific anomaly is Weak (+0.5°C to +0.9°C), Moderate (+1.0°C to +1.4°C), or Strong (+1.5°C+), as weak and strong events produce opposite snow patterns along I-95.
Overlay the CPC Temperature & Precipitation Tercile Outlooks
Compare the 90-day precipitation probability map with the temperature probability map. High snow potential requires active moisture meeting sub-freezing 850mb air.
Compare Deterministic Seasonal Maps Against Historical Analog Years
Look up the 3 closest historical ENSO analog winters in the NOAA NCEI Snowfall Composite database to see actual county-level inch departures.
Shift to 8–14 Day Teleconnection Maps (NAO, AO, PNA) in Winter
Seasonal maps show 90-day baselines, but individual snowstorms are triggered when a negative North Atlantic Oscillation (-NAO) blocks storms along the East Coast.
Curated Expert Video Walkthroughs & Wall Street Briefings


Frequently Asked Questions (Verified Statutory Answers)
Q1: Does an El Niño winter mean more snow or less snow in the US?
It depends entirely on your latitude. El Niño typically brings above-average snowfall to the Southern Rockies (New Mexico, southern Colorado), the Central/Southern Plains, and the Mid-Atlantic (Virginia, Maryland, D.C., Pennsylvania), while bringing below-average snowfall to the Pacific Northwest, Northern Rockies, and Upper Midwest.
Q2: What does 'Equal Chances' (EC) mean on a NOAA winter forecast map?
Equal Chances (EC) means that climate models do not show a statistically significant tilt toward above, near, or below normal conditions—each outcome has an equal 33.3% probability.
Q3: Why do Weak El Niño winters often produce more East Coast snow than Strong El Niño winters?
During a Strong El Niño, overwhelming Pacific warmth floods the US continent, turning coastal storms into rain along I-95. In a Weak El Niño, the southern storm track stays active while plenty of Arctic cold air remains available to produce major snowstorms.
Q4: How often does NOAA update its seasonal winter snowfall and precipitation maps?
The NOAA Climate Prediction Center updates its official 30-day and 90-day seasonal outlooks on the third Thursday of every month at 8:30 AM Eastern Time.