What is the official US winter weather forecast for 2026-2027 across regions?
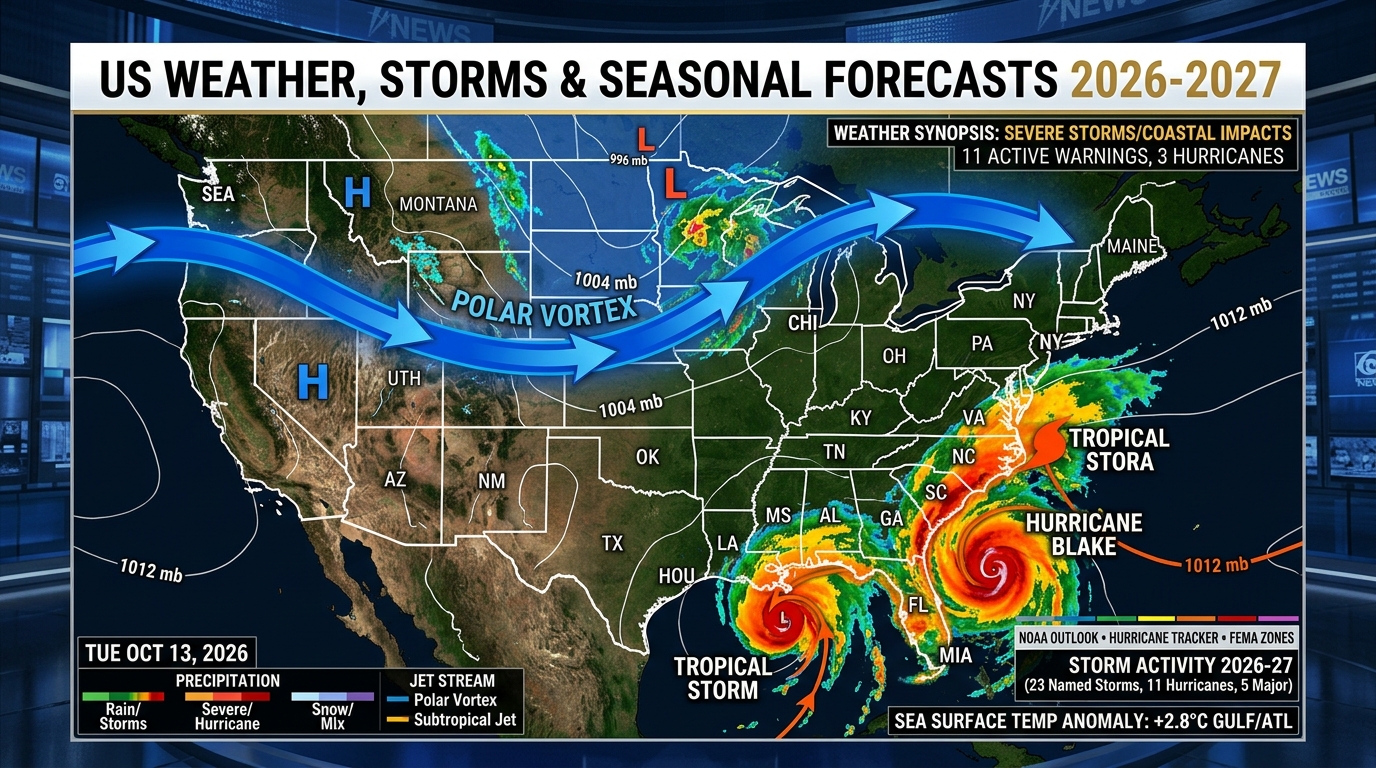
The 2026-2027 US winter weather forecast is shaped by an ENSO-neutral to weak La Niña Pacific transition, positioning the polar jet stream across the northern tier. Expect colder, snowier conditions across the Pacific Northwest, Northern Rockies, Upper Midwest, and Great Lakes, while the Southern Plains and Gulf Coast trend milder and drier with periodic Arctic cold snaps.
2026–2027 US Seasonal Weather Outlook, Named-Storm Deductible & Flood Gap Calculator
Select your US meteorological region, Coverage A dwelling value, and wind/hurricane percentage deductible to model your 2026–2027 seasonal weather exposure and FEMA / NFIP coverage gap.
1NOAA Climate Prediction Center vs. Farmers' Almanac: 2026-2027 Winter Consensus
Every autumn, millions of American homeowners, utility planners, and municipal road departments compare the National Oceanic and Atmospheric Administration (NOAA) Climate Prediction Center (CPC) three-month temperature and precipitation outlooks against the Old Farmer's Almanac and Farmers' Almanac seasonal forecasts. While consumer almanacs rely on solar cycle analogies and historical climatology, NOAA's operational seasonal forecast integrates coupled ocean-atmosphere dynamical models (including the North American Multi-Model Ensemble, NMME) with real-time equatorial Pacific sea surface temperature (SST) anomalies.
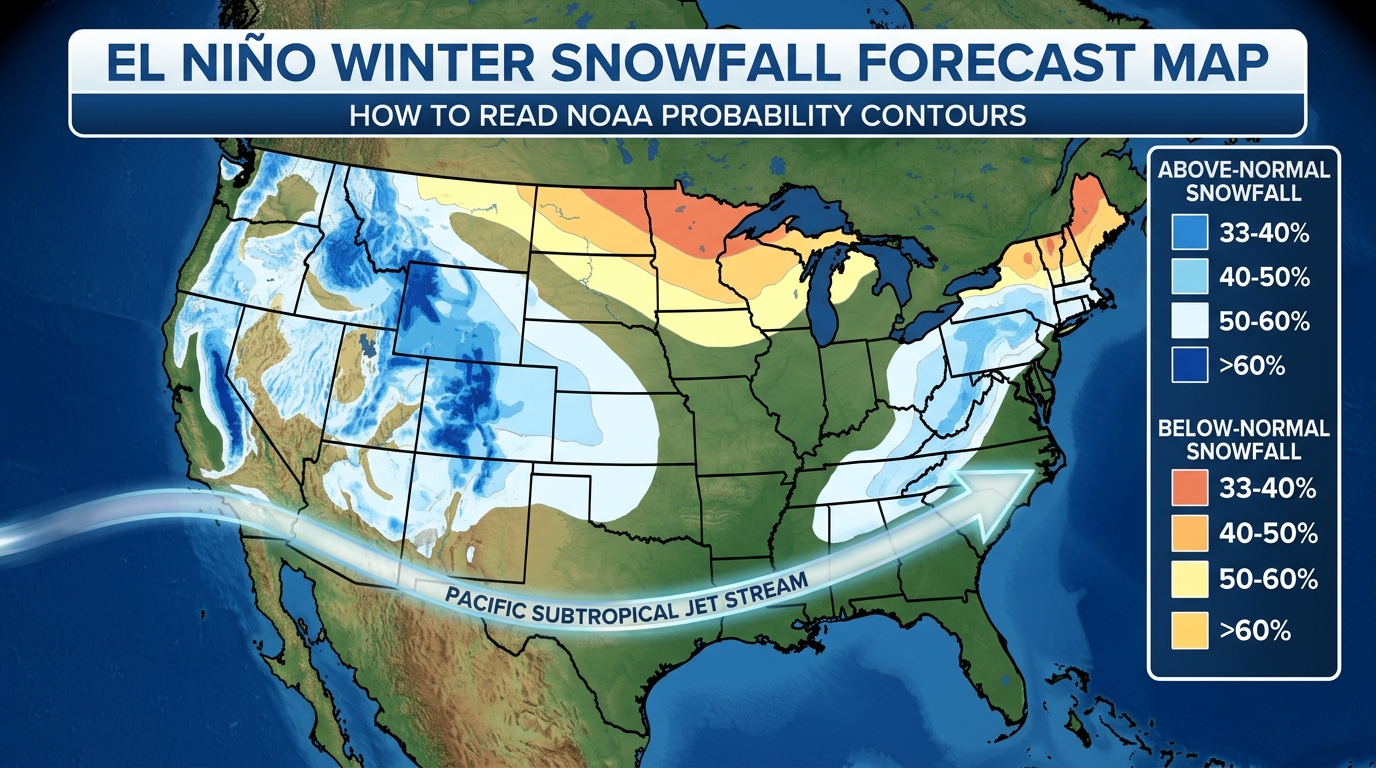
For the 2026-2027 winter season (December 2026 through February 2027), oceanic telemetry in the Niño 3.4 region indicates a transition between ENSO-neutral conditions and a weak-to-moderate cold phase (La Niña). When cooler-than-average equatorial Pacific waters persist, the Pacific jet stream amplifies northward over the Gulf of Alaska before diving southeastward across the Pacific Northwest, Northern Plains, and Great Lakes. This wave train locks colder Arctic air masses into the northern and central United States while steering frequent clipper systems and Great Lakes snowbands across the Snowbelt.
By contrast, the southern tier from Southern California through Arizona, Texas, and the Gulf Coast experiences a weaker subtropical jet stream during cold-neutral phases. While average winter temperatures across Texas and the Southeast trend 2°F to 4°F above normal over the full 90-day period, weak polar vortex stability allows sharp, short-lived meridional trough intrusions that can still push sub-freezing air deep into Dallas, Houston, and Atlanta for 72 to 120 hours at a time.
- Pacific Northwest & Northern Rockies (WA, OR, ID, MT, WY): Wet and cold; mountain snowpack projected at 120%-140% of the 30-year median.
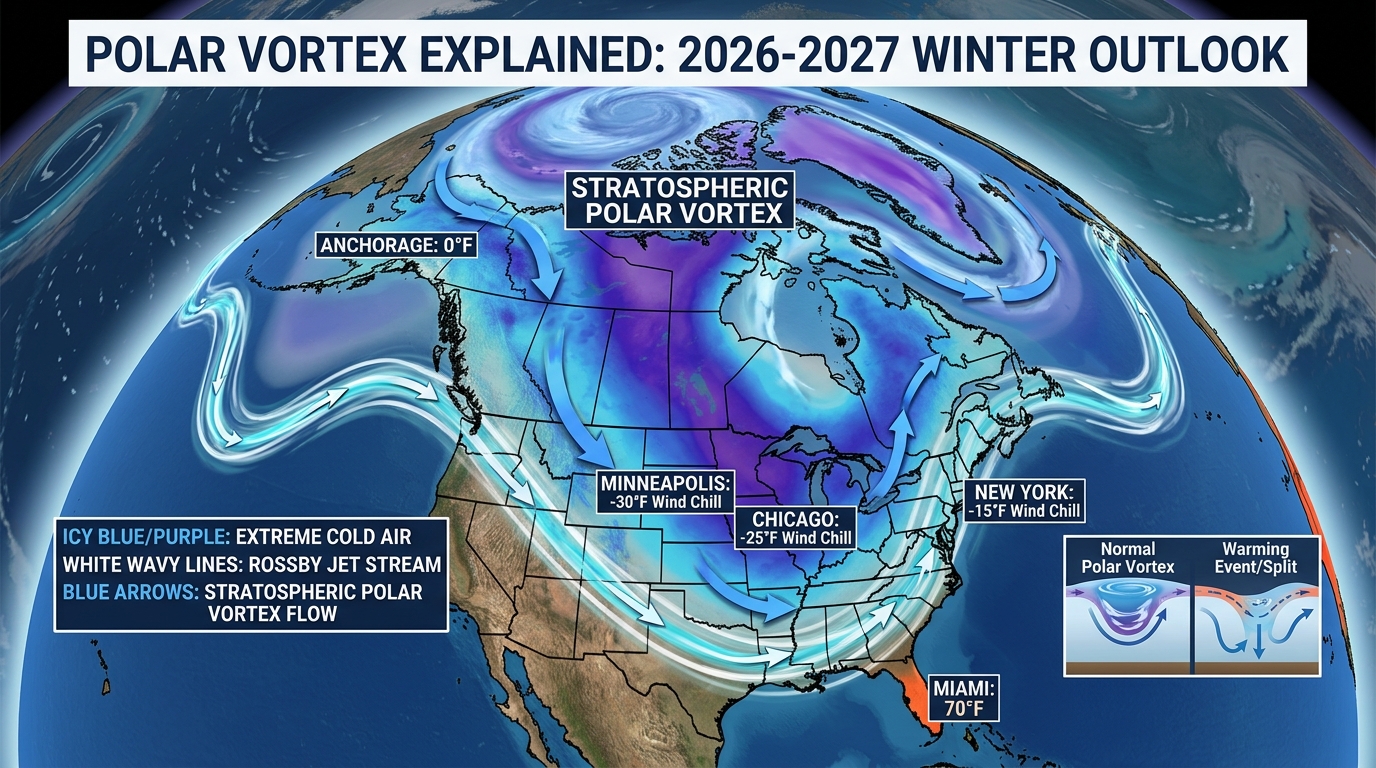
- Upper Midwest & Great Lakes (MN, WI, MI, IL, IN, OH): Frequent Alberta Clippers, sub-zero wind chill events in January, and heavy lake-effect snow.
- Northeast & Mid-Atlantic (NY, PA, MA, NJ, DC): Roller-coaster thermal swings; interior New England sees heavy snow while I-95 corridors face rain-to-ice coastal Nor'easters.
- South Central & Southeast (TX, OK, LA, GA, FL): Milder and drier baseline overall, but high vulnerability to sudden January-February Arctic cold fronts.
2Month-by-Month Winter Schedule (December 2026 – March 2027) & Freeze Zones
Timing winter weather hazards is critical for supply chains, agricultural operations, and residential heating budgets. December 2026 begins with an active early-season storm track across the Cascades, Sierras, and Northern Plains, accompanied by lake-effect snow outbreaks downwind of Lakes Superior, Michigan, Erie, and Ontario while reservoir temperatures remain relatively warm.
January and February 2027 represent the climatological core of winter severity. Stratospheric telemetry indicates elevated potential for a Sudden Stratospheric Warming (SSW) displacement event in mid-January 2027. When the stratospheric polar vortex weakens or splits near 60°N latitude, cross-polar flow drives bitter Siberian and Canadian Arctic air southward across the Continental Divide and Midwest within 10 to 14 days. During these outbreaks, nighttime lows can plunge to -20°F to -35°F in the Northern Plains and single digits as far south as the Red River Valley and Tennessee Valley.
March 2027 brings a classic late-winter battleground zone across the Central Plains, Ohio Valley, and New England. As Gulf of Mexico moisture returns northward and clashes with lingering Arctic high-pressure domes, Colorado Lows and Panhandle Hooks frequently produce heavy wet snow, ice accumulation, and early spring severe thunderstorm outbreaks across the Mid-South.
- December 2026: Early mountain snowpack buildup in the West; warm-lake snow squalls across Buffalo, Erie, Syracuse, and Grand Rapids.
- January 2027: Peak Arctic outbreak window; highest demand for residential natural gas, propane, and heating oil across the Midwest and Northeast.
- February 2027: Active Nor'easter storm track along the Eastern Seaboard and heightened ice storm risk from Arkansas through Kentucky and Virginia.
- March 2027: Late-season blizzards in the High Plains and rapid snowmelt flood risks along the Red River of the North and Upper Mississippi.
3Winter Heating Costs, Frozen Pipe Claims, and Storm Insurance Protection
According to the U.S. Energy Information Administration (EIA) Winter Fuels Outlook, residential heating expenditures are directly governed by regional Heating Degree Days (HDD) and fuel type. Households heating with natural gas (roughly 47% of US homes) face projected seasonal bills averaging $640 to $890 in the Midwest and Northeast, while homeowners relying on heating oil ($1,850 to $2,400 seasonal average) or delivered propane ($1,350 to $1,900) in rural New England and the Upper Midwest face significantly higher exposure during prolonged polar vortex freezes.
From a property insurance perspective, burst water pipes caused by sub-freezing temperatures represent the single costliest winter homeowners insurance claim category in the United States, averaging $14,200 to $28,500 per incident according to Insurance Information Institute (III) loss data. Standard HO-3 and HO-5 homeowners insurance policies cover sudden and accidental water damage from a burst pipe, provided the homeowner maintained reasonable heat in the structure (typically at least 55°F to 60°F) or shut off and drained the plumbing system prior to an extended winter absence.
However, external floodwater from rapid late-winter snowmelt or coastal storm surge during a Nor'easter is strictly excluded under standard homeowners policies. Protecting against overland snowmelt flooding requires an active National Flood Insurance Program (NFIP) or private flood policy, which carries a mandatory 30-day statutory waiting period under 42 U.S.C. § 4013 before coverage takes effect.
2026-2027 US Regional Winter Weather Outlook & Household Impact Matrix
| US Climate Region | Temperature Outlook | Snowfall / Precip Trend | Primary Winter Hazard | Avg Heating & Risk Exposure |
|---|---|---|---|---|
| Pacific Northwest & Rockies | 3°F to 5°F Below Normal | 120%–140% Normal Snow | Mountain Pass Blizzards & Ice | $750–$1,250 Heating / Roof Snow Load |
| Upper Midwest & Great Lakes | 4°F to 6°F Below Normal | 115%–135% Normal Snow | Polar Vortex Wind Chills (-35°F) | $850–$1,450 Heating / Frozen Pipes |
| Northeast & New England | Near Normal to -2°F Cooler | 110%–125% Interior Snow | Coastal Nor'easters & Ice Storms | $1,200–$2,300 Oil/Gas / Power Outages |
| Midwest & Ohio Valley | 2°F to 4°F Below Normal | Above Normal Precip | Panhandle Hook Snow & Freezing Rain | $780–$1,180 Heating / Sump Pump Backup |
| South Central & Gulf Coast | 2°F to 4°F Above Normal | 75%–90% Normal Precip | Sudden 72-Hour Arctic Freeze Snaps | $480–$720 Heating / Uninsulated Pipe Burst |
| Southwest & Southern California | 3°F to 5°F Above Normal | Below Normal Rainfall | Santa Ana Winds & Drought Persistence | $390–$610 Heating / Brush Fire Risk |
4-Step Winter Storm & Freeze Readiness Blueprint for US Households
Audit Pipe Insulation, Smart Leak Sensors & Water Shutoff Valves
Wrap exposed PEX and copper supply lines in unheated attics, crawlspaces, and garages with UL-listed heat tape and foam sleeves. Install automatic smart water shutoff valves to prevent $15,000+ burst pipe losses.
Verify Homeowners Insurance Water Backup & Service Line Endorsements
Confirm your HO-3 policy includes a $10,000 to $25,000 Water Backup & Sump Discharge endorsement ($50-$95/yr) to cover ice-thaw drain backups.
Lock Fixed Winter Heating Fuel Contracts & Emergency Backup Power
If using heating oil or propane, lock pre-season fixed-rate delivery contracts before December cold snaps and test carbon monoxide detectors alongside dual-fuel inverter generators.
Configure NWS Wireless Emergency Alerts (WEA) & Winter Car Survival Kit
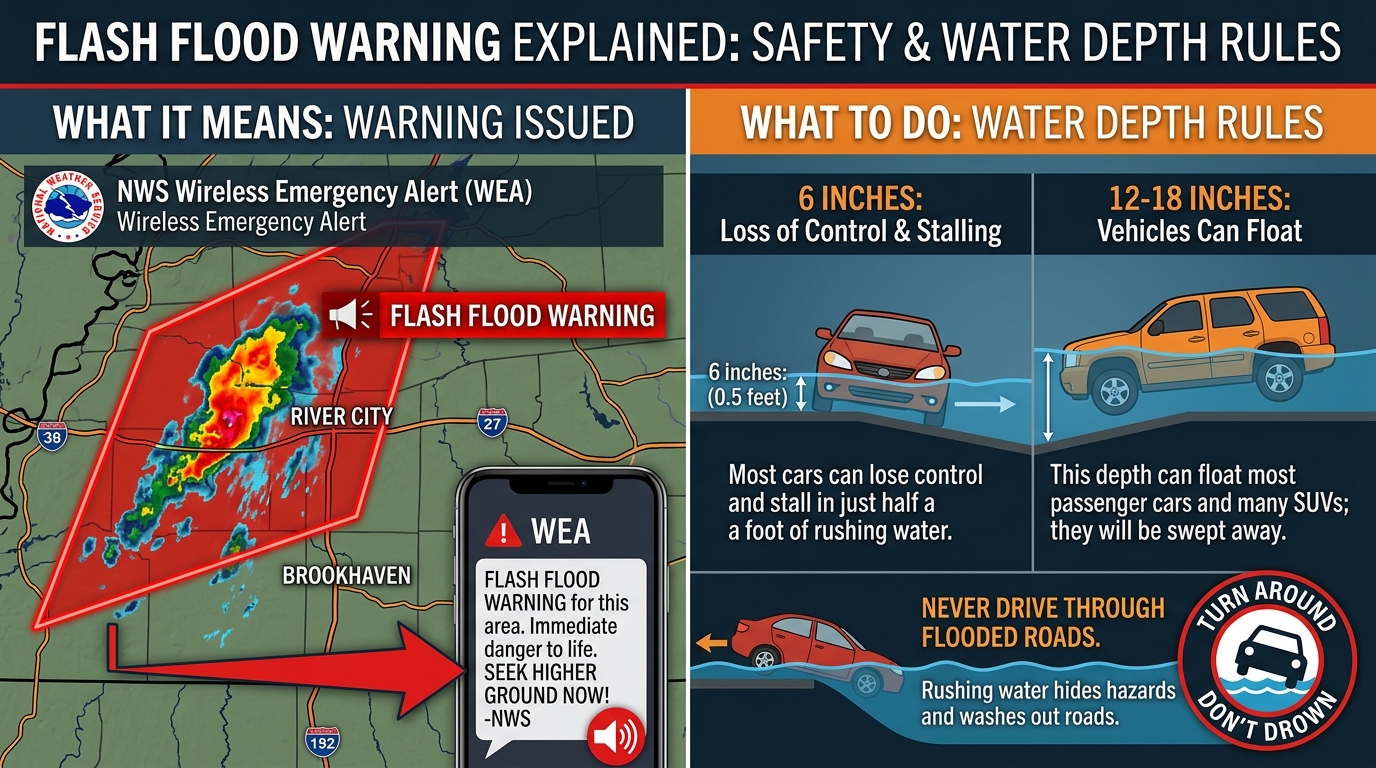
Enable National Weather Service Winter Storm Warning and Extreme Cold Warning notifications on your mobile device and equip vehicles with AGM jump starters, traction mats, and thermal blankets.
Curated Expert Video Walkthroughs & Wall Street Briefings



Frequently Asked Questions (Verified Statutory Answers)
Q1: Will winter 2026-2027 be colder and snowier than last year in the United States?
Yes across the northern half of the country. With Pacific sea surface temperatures shifting from strong warm anomalies toward ENSO-neutral/weak La Niña conditions, the northern tier (Pacific Northwest, Northern Plains, Great Lakes, and interior New England) is projected to see significantly more frequent Arctic cold fronts and 15% to 35% more snowfall than recent mild El Niño winters.
Q2: When is the coldest month of the 2026-2027 winter forecast?
Climatologically and dynamically, mid-January through mid-February 2027 carries the sharpest cold risk. Stratospheric wave activity peaks in January, increasing the likelihood of polar vortex displacement that sends sub-zero air into the Midwest, Plains, and East Coast.
Q3: Does homeowners insurance cover burst pipes from a winter freeze?
Yes, standard HO-3 homeowners insurance covers sudden and accidental water damage from a frozen burst pipe, subject to your policy deductible ($1,000-$2,500), provided you did not leave the home unheated without draining the plumbing system.
Q4: Where can I check official NOAA winter weather updates?
You can check official 30-day and 90-day seasonal temperature and precipitation probability maps directly on the NOAA Climate Prediction Center portal (cpc.ncep.noaa.gov) updated on the third Thursday of every month.