What is the difference between El Niño and La Niña and how do they affect US weather?
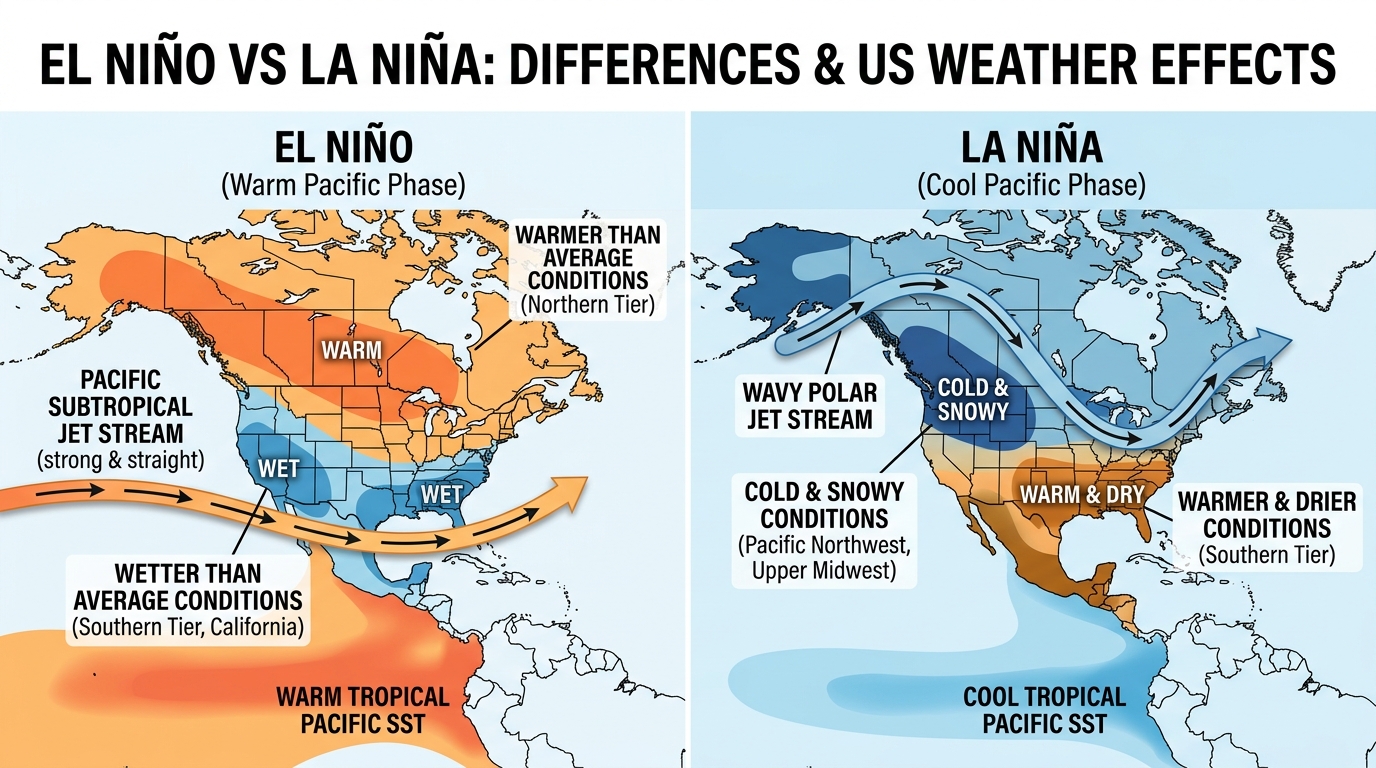
El Niño and La Niña are opposite phases of the El Niño-Southern Oscillation (ENSO) climate cycle in the equatorial Pacific Ocean. **El Niño** features warmer-than-average Pacific water (+0.5°C or higher), bringing wet, stormy winters to California and the US South, milder northern winters, and fewer Atlantic hurricanes. **La Niña** features colder-than-average Pacific water (-0.5°C or lower), bringing cold, snowy winters to the Pacific Northwest and Upper Midwest, drought to the Southwest/Texas, and more active Atlantic hurricane seasons.
Interactive El Niño vs. La Niña US Winter Snowfall & Jet Stream Decoder
Toggle between El Niño, ENSO Neutral, and La Niña phases across 7 US regions to see how Pacific sea-surface temperature anomalies shift winter snowfall contours and Atlantic hurricane shear.
1Ocean-Atmosphere Physics: How Pacific Trade Winds Create El Niño and La Niña
Together, **El Niño** ('The Little Boy' in Spanish, named by Peruvian fishermen who noticed warm coastal waters arriving around Christmas) and **La Niña** ('The Little Girl') form the oceanic half of the **El Niño-Southern Oscillation (ENSO)**—the single most powerful natural driver of year-to-year climate variability on Earth. Under normal conditions, persistent east-to-west trade winds blow across the tropical Pacific Ocean along the equator, pushing sun-warmed surface water into a deep pool near Indonesia and Australia while drawing cold, nutrient-rich water up from the ocean depths off the coast of Ecuador and Peru (a process called **upwelling**).
During an **El Niño** event (recurring irregularly every 2 to 7 years and lasting 9 to 12 months), those east-to-west trade winds weaken or even reverse direction. Without the wind holding it back, the massive pool of warm western Pacific water sloshes eastward across the International Date Line toward South America, shutting down cold upwelling and raising Sea Surface Temperatures (SSTs) in the east-central equatorial Pacific (the **Niño 3.4 region**, 5°N–5°S, 170°W–120°W) by +0.5°C to +2.5°C above average.
During a **La Niña** event (which can persist for 1 to 3 consecutive years, known as a 'double-dip' or 'triple-dip' La Niña), the equatorial trade winds blow even *stronger* than normal. This hyper-charges cold deep-ocean upwelling off South America and pushes warm surface water far into the western Pacific, dropping Niño 3.4 temperatures to -0.5°C to -2.0°C below the 30-year average.
- Official NOAA ONI Criterion: Requires five consecutive overlapping 3-month periods at or above +0.5°C (El Niño) or at or below -0.5°C (La Niña).
- Walker Circulation Shift: El Niño shifts tropical rising air and thunderstorms to the central/eastern Pacific; La Niña concentrates tropical convection over Indonesia and the Maritime Continent.
- Global Atmospheric Teleconnections: Tropical Pacific heating acts like a boulder dropped into a river, sending Rossby wave trains that reposition jet streams over North America.
2US Winter Weather Effects: How El Niño vs. La Niña Flip the Jet Stream
The most dramatic impact of El Niño vs. La Niña across the United States occurs during the northern hemisphere winter and early spring (November through March), when the Pacific jet stream reaches peak strength. Because the jet stream flows along the boundary between warm tropical air and cold polar air, shifting tropical Pacific heat thousands of miles east or west completely reconfigures the North American storm track.
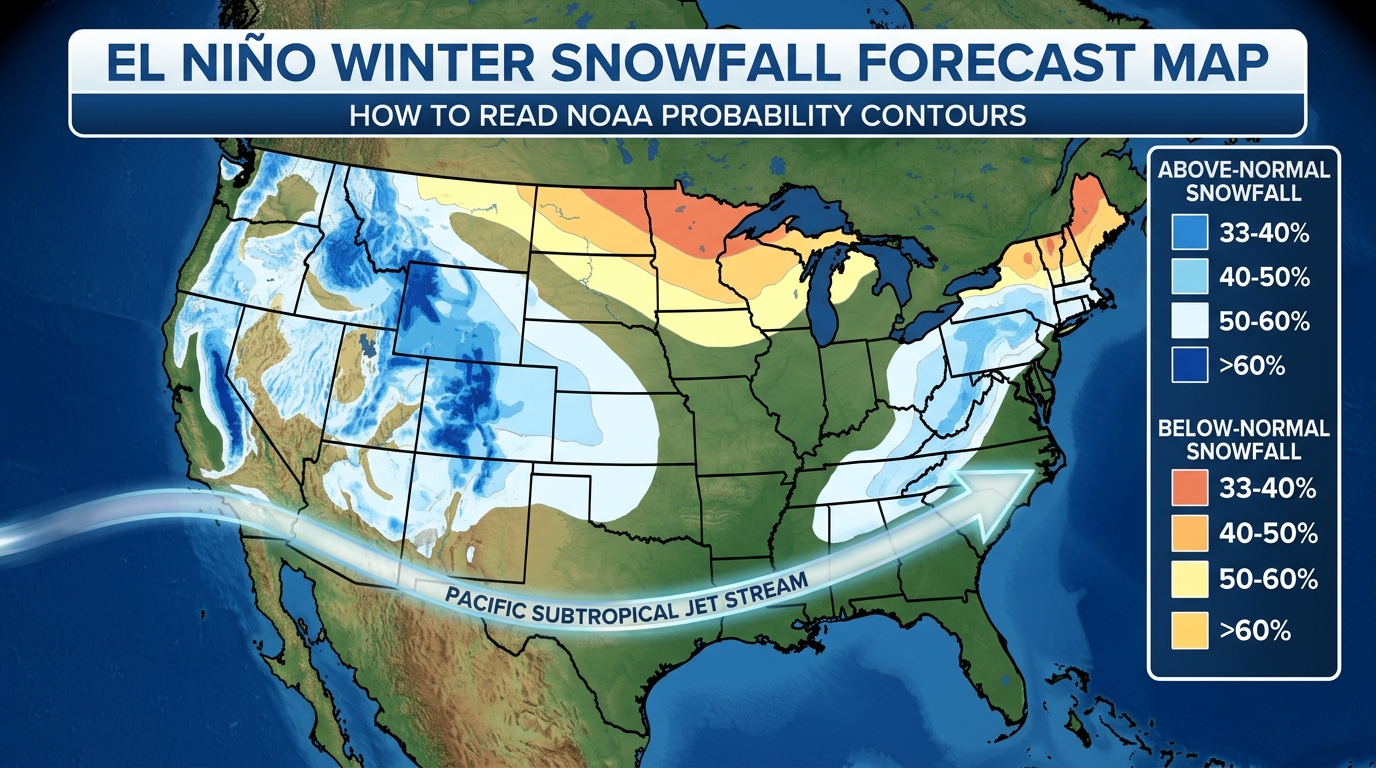
In an **El Niño winter**, the southern **Subtropical Jet Stream** accelerates into a powerful, straight west-to-east river of moisture aimed directly at Southern California, Arizona, New Mexico, Texas, and the Gulf Coast. This delivers frequent atmospheric rivers to California, heavy mountain snow to the Four Corners, cool rainy weather across Texas and Florida, and occasional blockbuster Mid-Atlantic Nor'easters—while trapping mild Pacific air across Seattle, Montana, Minnesota, and the Great Lakes.
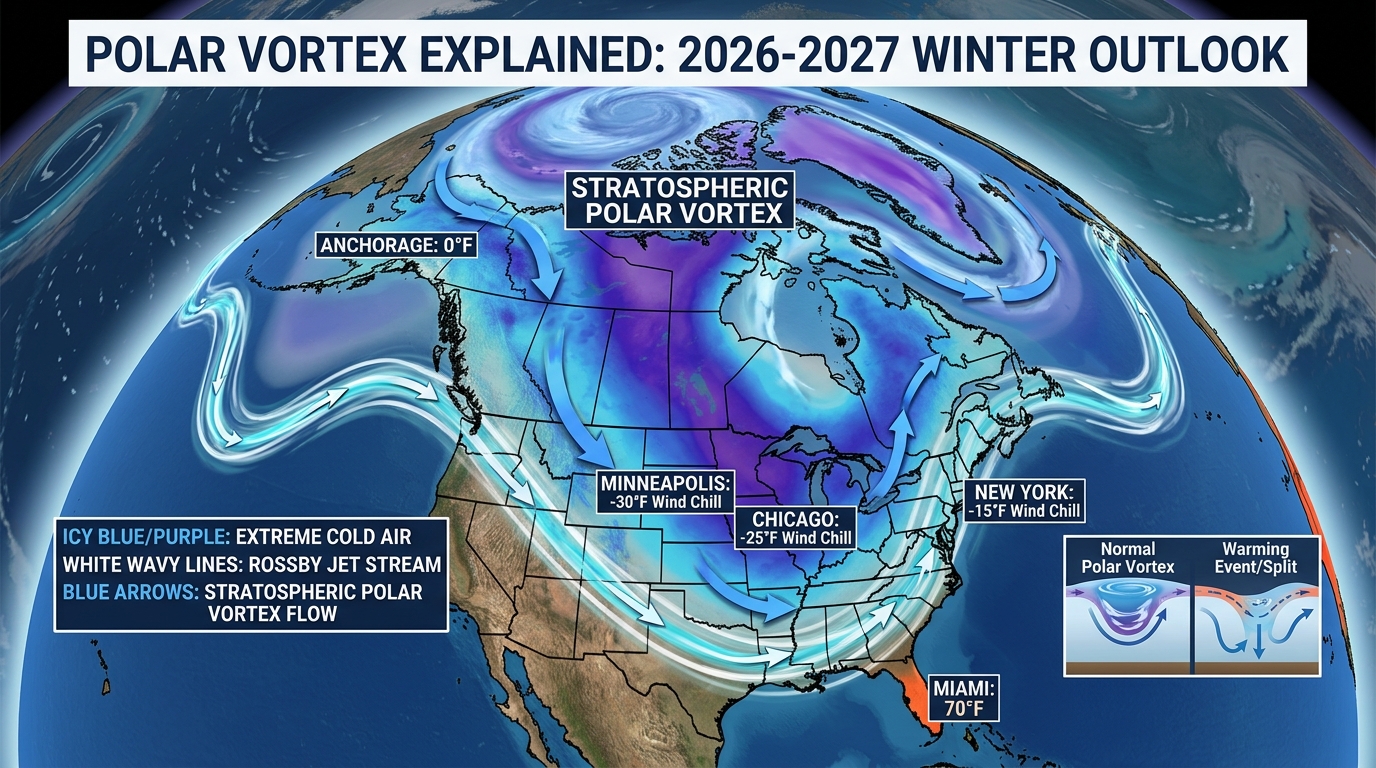
In a **La Niña winter**, a strong high-pressure blocking ridge builds over the North Pacific while the **Polar Jet Stream** dives sharply southeastward across Washington, Oregon, Idaho, Montana, the Dakotas, and the Great Lakes. The Pacific Northwest and Northern Rockies experience abundant snowpack, the Upper Midwest endures frequent sub-zero Arctic clippers, and the Ohio Valley sees heavy precipitation, while the entire Southern Tier (Southern California, the Southwest, Texas, and the Southeast) turns warm, sunny, and drought-prone.
3Beyond Winter: How El Niño and La Niña Impact Hurricanes, Tornadoes & Crops
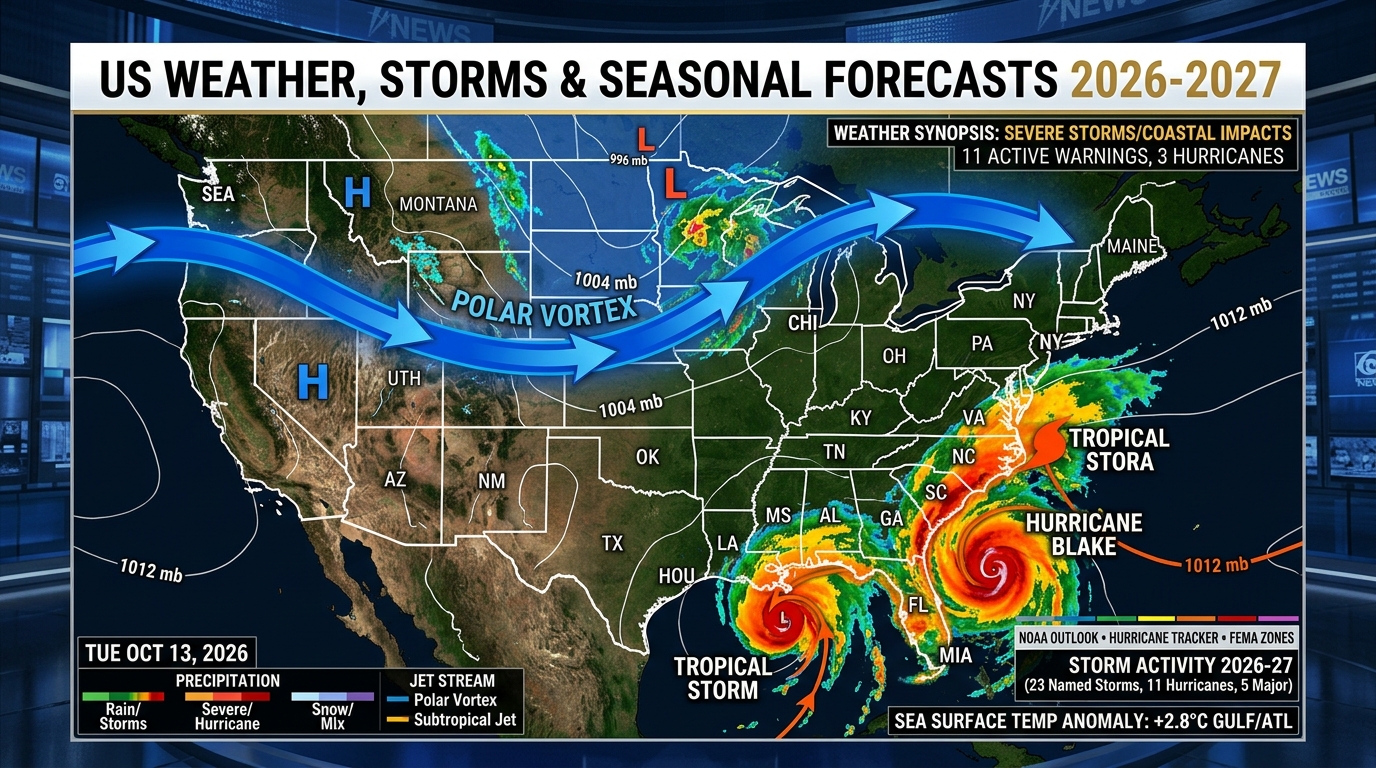
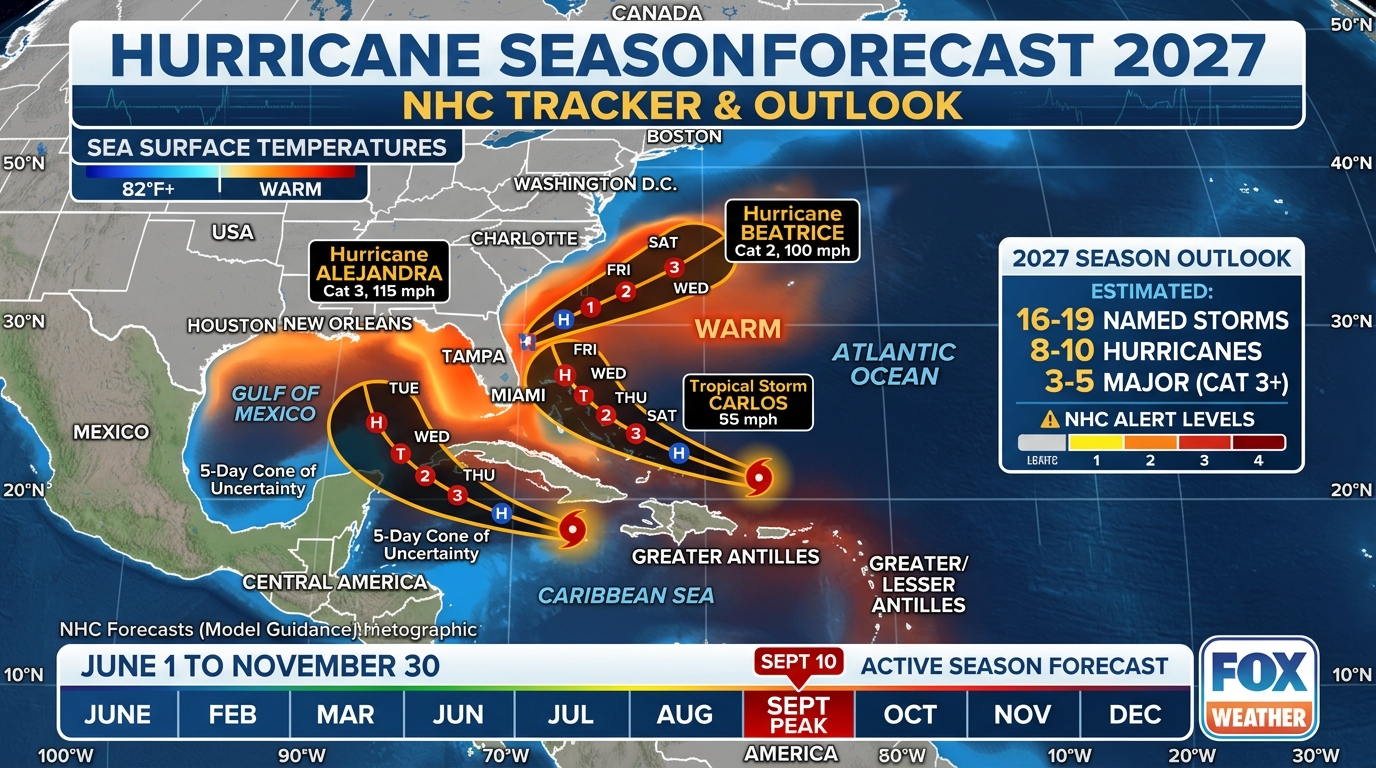
ENSO's reach extends far beyond winter snow maps into spring tornado alleys, summer crop yields, and autumn hurricane tracks. During **Atlantic Hurricane Season (June–November)**, El Niño strengthens upper-level westerly winds (vertical wind shear) across the Caribbean Sea and tropical Atlantic, which literally shears the tops off developing tropical storms and suppresses Atlantic hurricane counts (while boosting Eastern Pacific hurricanes near Mexico and Hawaii). Conversely, **La Niña** relaxes Atlantic wind shear and lowers atmospheric sinking motion, fueling hyperactive Atlantic hurricane seasons with higher odds of Gulf and East Coast landfalls.
In the spring (March–May), research from Columbia University and NOAA's National Severe Storms Laboratory shows that **La Niña** and transitioning cold-neutral springs correlate with heightened severe thunderstorm, large hail, and tornado outbreak activity across the Mid-South, Dixie Alley, and the Ohio/Tennessee Valleys as a wavy jet stream overrides warm Gulf moisture.
El Niño vs. La Niña vs. ENSO-Neutral: Complete US Weather & Climate Comparison Table
| Climate Dimension | El Niño (Warm Phase) | La Niña (Cold Phase) | ENSO-Neutral |
|---|---|---|---|
| Niño 3.4 Ocean Temp Anomaly | ≥ +0.5°C warmer than 30-yr average | ≤ -0.5°C cooler than 30-yr average | -0.4°C to +0.4°C (Near Average) |
| Pacific Trade Winds | Weakened or reversed (blowing west-to-east) | Abnormally strong (blowing east-to-west) | Normal east-to-west trade wind strength |
| Dominant US Winter Jet Stream | Strong Southern Subtropical Jet Stream | Amplified Wavy Northern Polar Jet Stream | Driven by sub-seasonal AO / NAO / MJO waves |
| Wet & Snowy US Winter Regions | California, Southwest, Texas, Gulf Coast, Mid-Atlantic | Pacific Northwest, N. Rockies, Upper Midwest, Ohio Valley | Highly variable; favors interior Northeast & Plains |
| Dry & Mild US Winter Regions | Pacific Northwest, Montana, Upper Midwest, Great Lakes | Southern California, Arizona, Texas, Florida, Southeast | No persistent 90-day regional drought lock |
| Atlantic Hurricane Season Effect | Suppressed (High vertical wind shear tears storms apart) | Enhanced (Low wind shear fuels more Cat 3–5 hurricanes) | Near-to-above average (governed by Atlantic SSTs) |
| Spring Tornado & Hail Risk | Shifted south toward Gulf Coast & Florida | Elevated tornado & hail frequency in Mid-South & Ohio Valley | Classic Plains Tornado Alley climatology |
4-Step Guide to Using ENSO Forecasts for Household & Financial Planning
Check the Monthly NOAA CPC ENSO Diagnostic Discussion
Published on the second Thursday of every month, the NOAA ENSO Diagnostic Discussion provides official probability bars for El Niño, Neutral, and La Niña out 9 months in advance.
Adjust Winter Home Heating & Snow Removal Budgets by Phase
Northern tier and Midwest households should budget 15%–25% higher heating and snow-clearing reserves during La Niña winters, while Southern and Mid-Atlantic homeowners should prepare for El Niño coastal storms.
Review Coastal Hurricane & Flood Coverage Ahead of La Niña Summers
When NOAA projects La Niña conditions for August–October, Gulf and Atlantic Coast homeowners face significantly higher landfall odds and should verify wind and flood policies before May.
Monitor Southwestern Water & Wildfire Risk During Multi-Year La Niñas
Because La Niña diverts winter storms north of Southern California, Arizona, and Texas, multi-year La Niña cycles heighten municipal water restrictions and autumn brush fire risks.
Curated Expert Video Walkthroughs & Wall Street Briefings



Frequently Asked Questions (Verified Statutory Answers)
Q1: What is the main difference between El Niño and La Niña in simple terms?
El Niño is the warm phase of the Pacific Ocean cycle (sea surface temperatures at least 0.5°C above normal), which pushes the storm track across the southern US. La Niña is the cold phase (temperatures at least 0.5°C below normal), which pulls the storm track across the northern US and dries out the South.
Q2: Which is worse for Atlantic hurricanes: El Niño or La Niña?
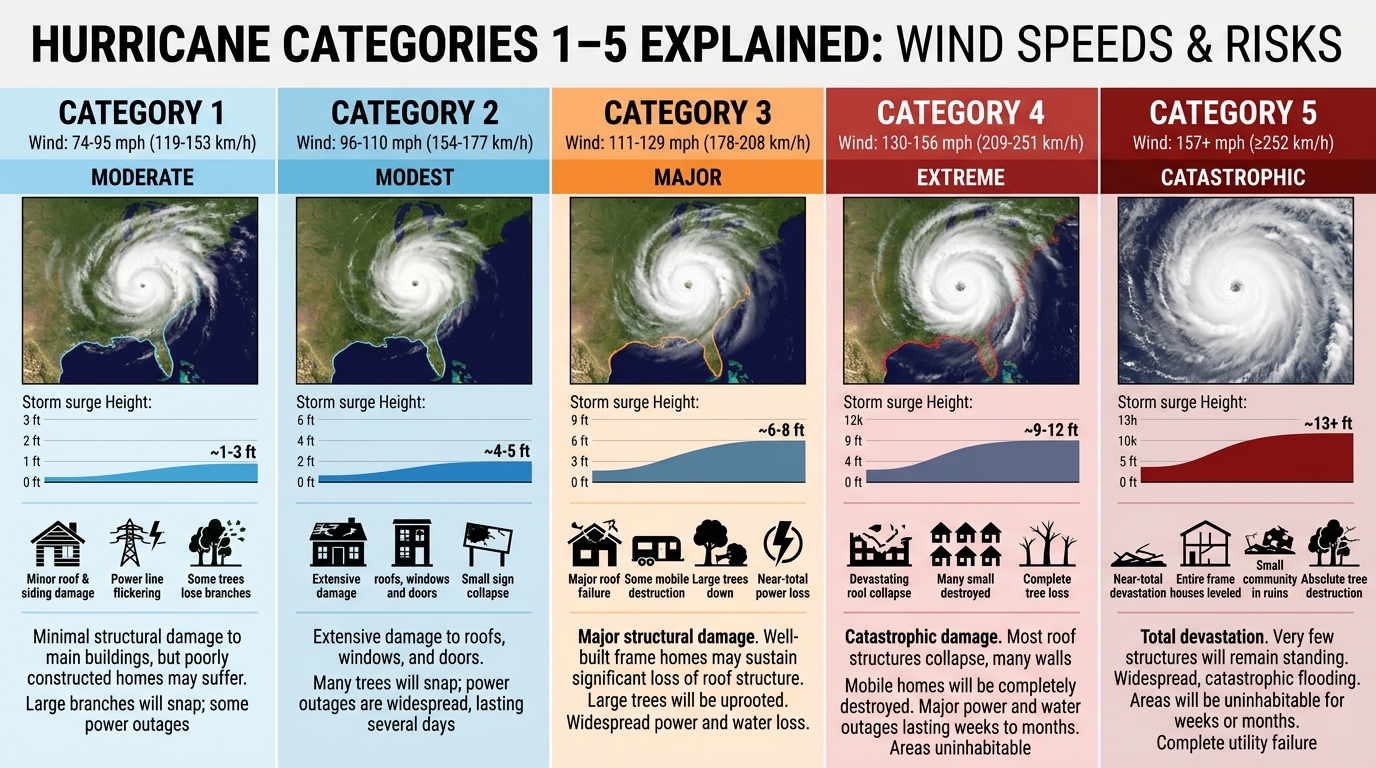
La Niña is much more dangerous for the Atlantic hurricane season. La Niña reduces upper-level wind shear over the Caribbean and Atlantic Ocean, allowing more tropical waves to organize into major Category 3–5 hurricanes.
Q3: How long do El Niño and La Niña events last?
An El Niño event typically lasts 9 to 12 months, peaking between November and January before fading in the spring. La Niña events often last longer—frequently 1 to 3 consecutive winters ('double-dip' or 'triple-dip' La Niñas).
Q4: What does 'ENSO-Neutral' mean for US weather?
ENSO-Neutral means equatorial Pacific ocean temperatures are within -0.4°C to +0.4°C of the long-term average. Without strong Pacific forcing, US winter weather is driven by shorter-term atmospheric patterns like the Arctic Oscillation (AO) and Madden-Julian Oscillation (MJO).